AIA Stock Drops 1.51%, Momentum Gains In Focus
On Agustus 5, 2026: price 78.05 HKD, trend sideways, RSI 58.6, support 72.30, resistance 79.65. technical analysis of aia stock. AIA Stock Drops — full details…
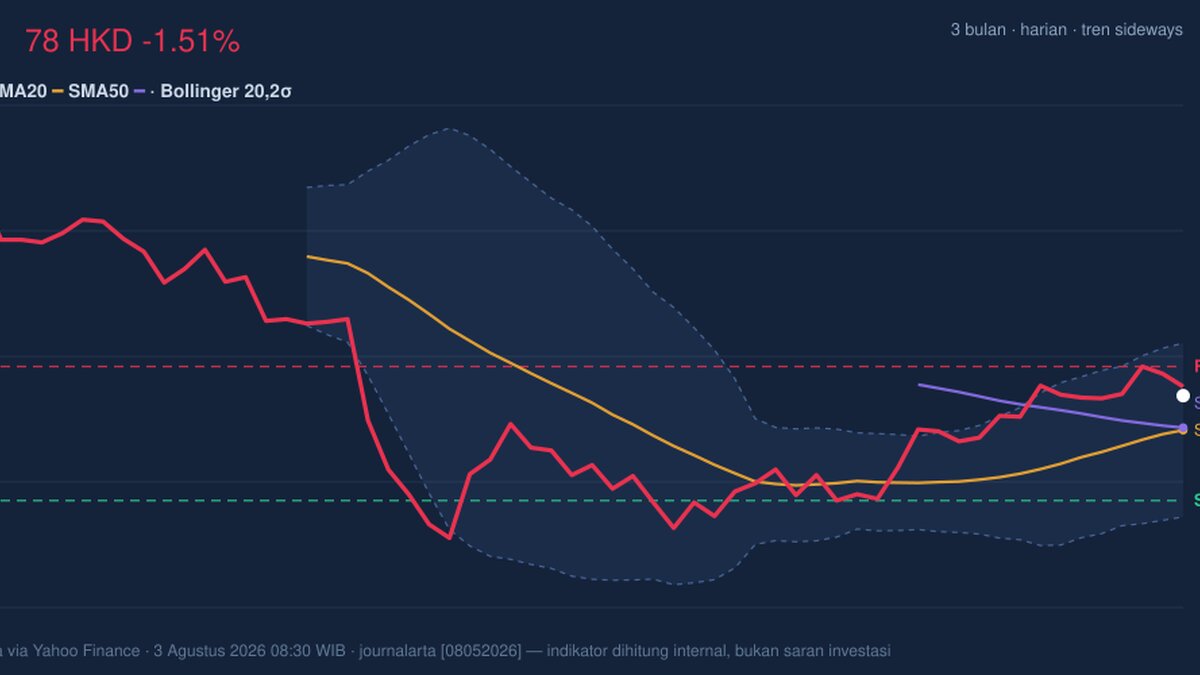
78.05 HKD on AIA Group slipped 1.51% from the previous close of 79.25, but the move still leaves the shares above both the 20-day and 50-day averages, a sign that the recent pullback has not yet broken the broader short-term structure. The chart, as shown below, points to a market that is no longer accelerating higher, yet has not rolled over into a clear downtrend either.
Trend & Price Action
The most important signal is that price is above SMA20 at 76.17 and also above SMA50 at 76.30, which keeps the stock on the constructive side of its recent range. That matters because a price sitting above both moving averages usually means recent buyers are still defending the trend, even if conviction is not strong enough to force a breakout.
The slope of SMA20 at 2.00% over 5 days shows the short-term trend is still leaning upward, but only moderately. In other words, the base is rising, yet not with the kind of force that typically accompanies a decisive trend leg. The lack of a new MA-cross also suggests the market has not produced a fresh technical trigger; this is more of a consolidation phase than a trend reversal.
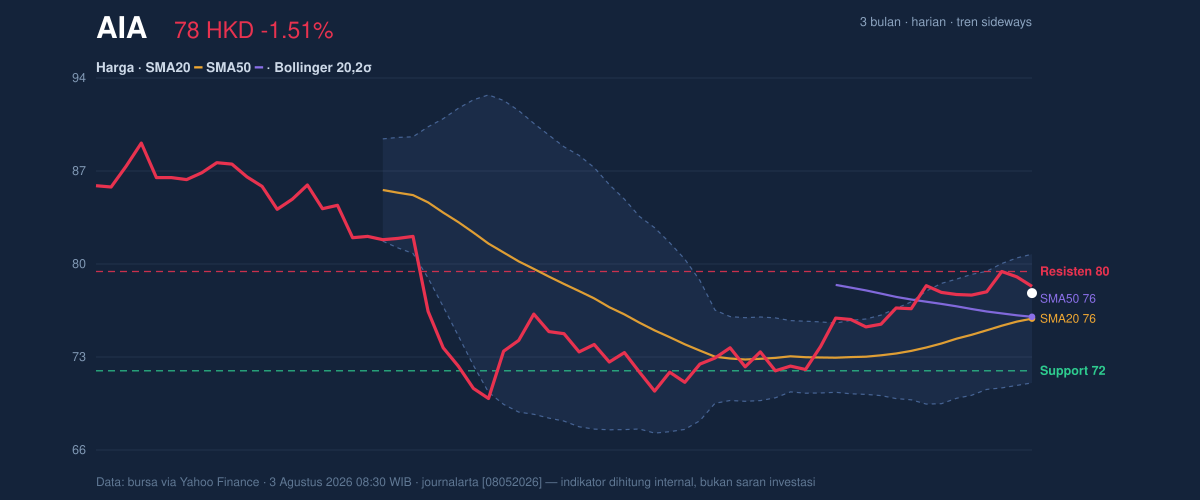
The price is trading at about 78% of the 20-hour range, between support at 72.30 and resistance at 79.65. That placement is important: it shows the stock is closer to the upper end of its recent band, but not yet through the ceiling. The 3-month range of 89.95 to 69.05 gives context. A stock sitting in the upper half of that band is not weak, but it is still well below the prior peak, which tells readers the recovery has room to prove itself.
Oscillators & Momentum
Momentum is not weak, but it is mixed. RSI at 58.6 is neutral, which means the shares are neither stretched nor washed out. That is often the profile of a stock in transition: enough strength to avoid oversold conditions, but not enough urgency to signal a breakout is already underway.
The stochastic reading is more nuanced. %K at 72.2 and %D at 85.4 sit in neutral territory, but the gap between the two lines suggests the faster line is below the slower line, a sign that short-term momentum has cooled after earlier strength. This is not a bearish reversal by itself. It is more a warning that the pace of the advance has slowed.
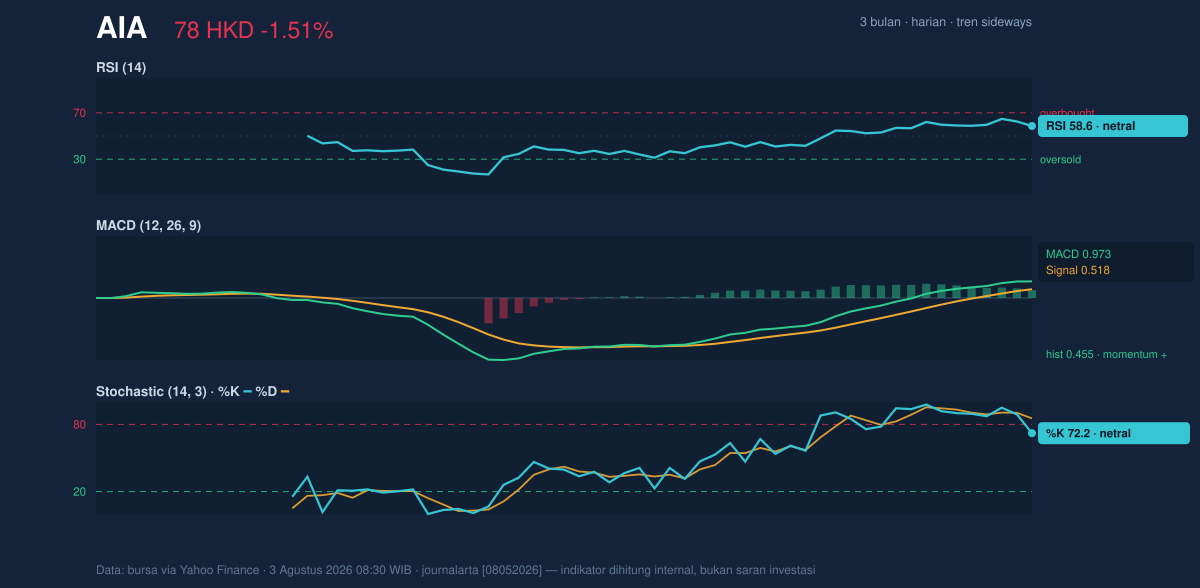
The stronger message comes from MACD. MACD at 0.973 remains above the signal line at 0.518, with a positive histogram of 0.455. For general readers, that means the trend engine is still producing upward momentum, even if the stock has paused. The histogram being above zero shows the bullish bias is still alive; it has simply become less forceful than at the most active part of the move.
Volatility & Volume
Volatility is moderate. ATR at 1.82, or 2.3% of price, implies the stock is moving enough to matter, but not in a disorderly way. The Bollinger Bands add another layer: price sits inside a normal-width band, with the middle band at 76.17, the upper band at 80.93, and the lower band at 71.41. The band width of 12.5% is not compressed, so this is not a classic squeeze setup. It also is not an expansion phase that usually precedes a sharp directional break. The message is balance, not urgency.
%B at 70% means the price is in the upper part of the Bollinger envelope, which supports the idea that buyers still have the upper hand. But because the stock is not pressing into the top band, the market is showing respect for resistance rather than challenging it aggressively.
Volume weakens the case for immediate follow-through. Last volume was 20,353,345, below the 20-hour average of 22,563,568, or 0.9 times normal. That means the latest move higher did not arrive with stronger participation, and the OBV is falling, which signals that trading flow has not been confirming price stability. When price holds up while OBV drifts lower, it often means the rally is losing sponsorship beneath the surface.
Key Levels & Scenarios
The nearest ceiling is 79.65 resistance. A clean move through that level would matter because it would place the stock above the recent range cap and closer to the upper Bollinger band at 80.93. On the downside, 76.17 and 76.30 are the first technical cushions, since both the 20-day and 50-day averages sit there. Below that, the more important support is 72.30. A break of that floor would shift the market from consolidation into a weaker structure.
The current setup can be read as a market waiting for confirmation. If price can clear resistance with stronger participation, the technical picture improves. If it cannot, the stock is more likely to keep rotating inside the band, with the moving averages acting as a magnet.
Technical Verdict: HOLD (wait & see)
HOLD (wait & see) because the chart shows a constructive but unconfirmed setup: price remains above SMA20 and SMA50, MACD is positive, yet volume is below average and OBV is falling, which weakens conviction. RSI is neutral, so momentum is not stretched, but it is also not strong enough to force a breakout. The verdict is invalidated if price falls below 72.30, because that would break the nearest meaningful support and damage the current range structure.
- Ideal Entry Range: 76.17 to 76.30, where the stock meets the two moving averages and the Bollinger middle band
- Exit Target: 79.65, with 80.93 as the upper Bollinger reference if resistance gives way
- Stop Loss Protection: 72.30, the nearest range support
For non-traders: the shares are holding up, but the market has not yet shown enough strength to prove the next move is higher.
The latest 3-month high is 89.95 and the latest 3-month low is 69.05.
Summary Data AIA
| Last price | 78.05 HKD |
| Change 1 day / 5 days / 1 month | -1.51% / 0.13% / 5.47% |
| Trend / MA-cross | sideways / none |
| SMA20 / SMA50 | 76.17 / 76.30 |
| RSI (14) / Stochastic %K | 58.6 / 72.2 |
| Bollinger %B / ATR | 70% / 1.82 |
| Support / Resistance 20 days | 72.30 / 79.65 |
| Data as of | 3 Agustus 2026 08:30 WIB |
Track AIA share price daily: live levels, support/resistance and our full AIA analysis history.



