Alibaba Stock Gains 7.52% Today, Golden Cross Formed
On Agustus 5, 2026: price 125.80 HKD, trend uptrend, RSI 66.9, support 95.80, resistance 125.20. technical analysis of alibaba stock. Alibaba Stock Gains —…
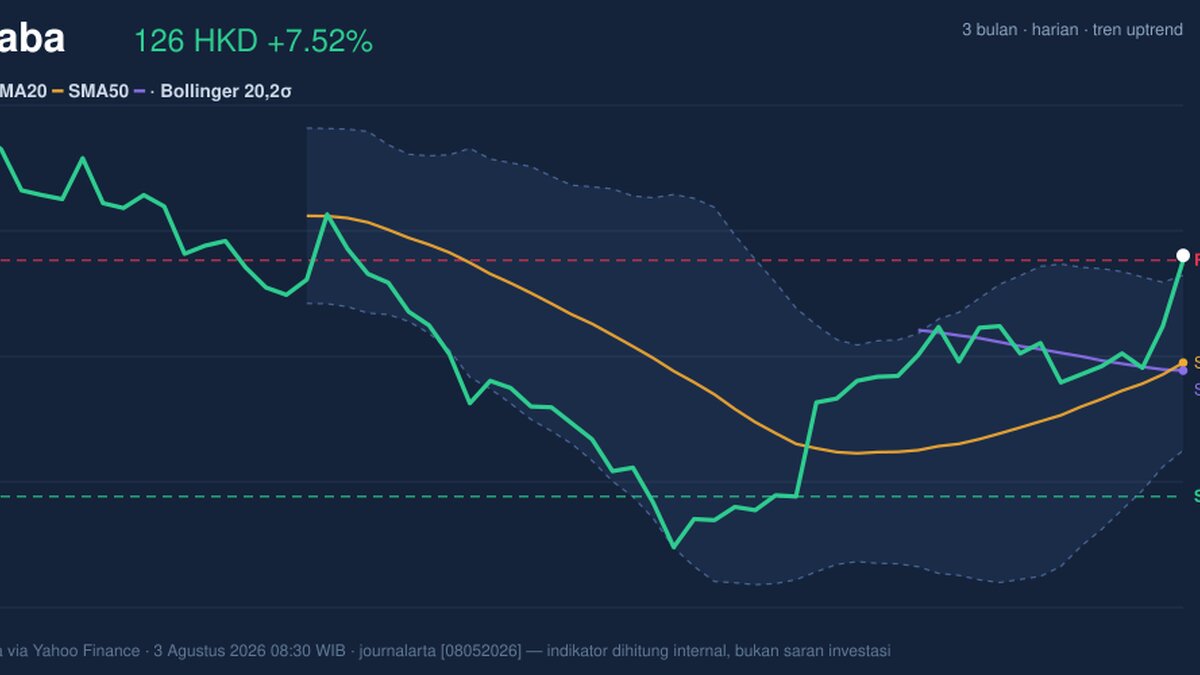
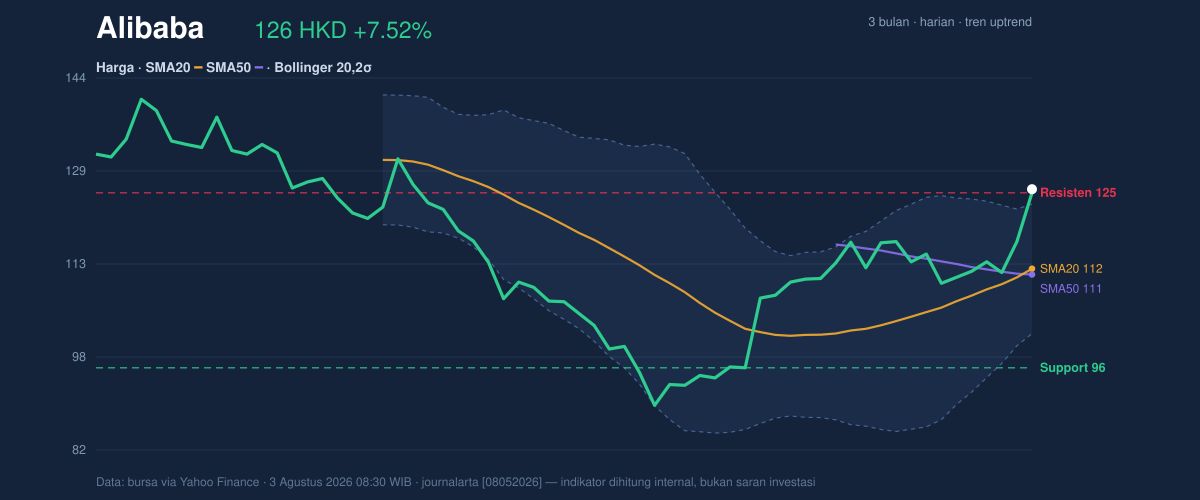
Alibaba Group’s Hong Kong-listed shares rose to 125.80 HKD on HKEX, extending a one-day gain of 7.52% and pushing the stock above a key short-term ceiling, according to exchange data cited in Yahoo Finance. The move leaves the shares in a clearly uptrend, with the price now trading above both the SMA20 at 112.44 and the SMA50 at 111.48, while the golden cross — where the 20-day average moves above the 50-day average — signals that recent buying has overtaken the slower-moving trend. The message from the chart is straightforward: momentum has not just improved, it has begun to dominate the structure.
Trend & Price Action
As shown in the chart, Alibaba’s latest print sits well above its short- and medium-term moving averages, which is usually what technicians look for when a rebound starts to mature into a trend. The 5.10% five-day slope in SMA20 matters because it shows the average itself is rising, not just the spot price bouncing around it. That distinction is important: a rising average suggests the market has been accepting higher prices over several sessions, which often attracts systematic traders and trend followers. The stock is also trading near the top of its recent range, with 20-hour resistance at 125.20 now effectively tested and the share price at 102% of the 20-hour range, meaning it has moved beyond the zone where it spent most of the recent session. The broader three-month band adds context: the stock is still below the 3-month high of 144.00, but comfortably above the 3-month low of 88.65, leaving room for continuation if the current breakout holds.
The catch is that sharp advances often run into profit-taking when they reach nearby resistance.
That is exactly where Alibaba is now.
Oscillators & Momentum
The momentum picture is supportive, but not uniformly healthy. The RSI at 66.9 is still described as neutral in the dataset, which suggests the stock has not yet entered a classic exhaustion zone. However, the Stochastic %K at 95.5 versus %D at 67.1 is firmly overbought, a sign the latest rally has moved faster than the broader short-term trend may comfortably sustain. In plain language, stochastic is telling investors that the stock is closing near the top of its recent trading range, often a condition seen after a strong burst of buying. That does not automatically mean reversal, but it does raise the odds of a pause or pullback if follow-through weakens. The positive counterweight is the MACD at 2.344, above its signal line at 1.128, with a histogram of 1.216. MACD is a trend-confirmation tool, and this positive spread suggests upside momentum is still expanding rather than fading.
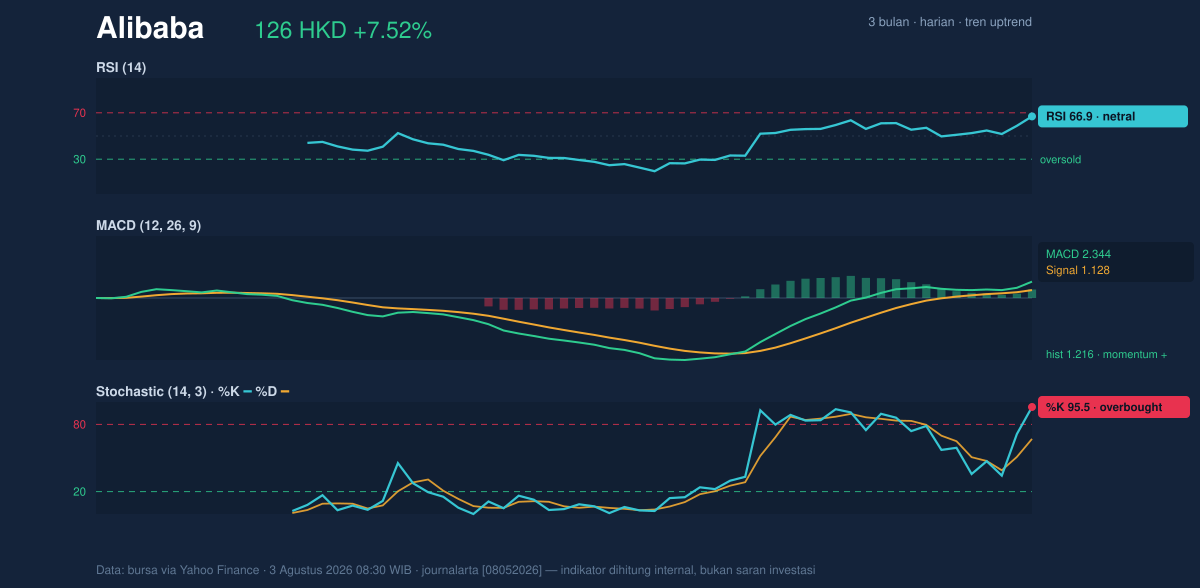
So the oscillators are not fully aligned.
Momentum is strong, but stretched.
Volatility & Volume
Volatility is elevated enough to matter. The ATR(14) at 5.54, or 4.4% of price, indicates that day-to-day swings are likely to remain wide. For general readers, ATR measures the stock’s typical movement range; a higher reading means larger intraday and multi-day fluctuations, which can make breakouts look dramatic and pullbacks look equally abrupt. Bollinger Bands reinforce that idea. The upper band sits at 123.33, and the current price is above it, with %B at 111%. That means the share price is trading beyond the upper band, a sign of strong upside pressure but also one that often appears when a move is extended relative to recent volatility. The band width of 19.4% is described as normal, so this is not a compression setup waiting to explode; instead, it is an active move that has already expanded.
Volume confirms participation. The latest turnover of 192,268,809 shares is about 1.6× the 20-session average of 120,645,927, and OBV is rising. That combination matters because price gains backed by heavier trading are usually more credible than thin rallies. Rising OBV means volume has been accumulating on up days, a classic sign that buyers are not just present, but persistent.
Key Levels & Scenarios
The nearest technical floor is the 20-hour support at 95.80, while the most immediate ceiling is the 20-hour resistance at 125.20. With the stock now at 125.80, the market is effectively probing above that barrier, so the key question is whether it can convert resistance into support. If that happens, the chart would likely support a continuation toward the next visible reference area near the 3-month high at 144.00. If the price slips back below the breakout zone and fails to hold the rising average cluster around the SMA20 at 112.44, the move would look less like trend extension and more like a failed breakout. The Bollinger upper band at 123.33 is also important: sustained trade above that level suggests persistent strength, while a return below it would hint that the rally is losing altitude.
Technical Verdict: HOLD (wait & see)
HOLD (wait & see)
- MACD remains positive, with the line above the signal line and a positive histogram, showing trend momentum is still intact.
- Price is above SMA20 and SMA50, and the golden cross confirms the short-term trend has turned constructive.
- Stochastic is overbought and price is above the Bollinger upper band, which raises the risk of a near-term pause after a steep run.
Verdict invalidated if price falls below 112.44, the SMA20 and Bollinger middle band.
- Ideal Entry Range: 112.44 to 123.33 HKD
- Exit Target (Target Price): 125.20 HKD, with the next technical reference at 144.00 HKD
- Stop Loss protection: 95.80 HKD
For non-traders, this means the stock is strong, but it has already moved far enough that the next few sessions matter more than the last few.
Summary Data Alibaba
| Last price | 125.80 HKD |
| Change 1 day / 5 days / 1 month | 7.52% / 13.33% / 31.11% |
| Trend / MA-cross | uptrend / golden |
| SMA20 / SMA50 | 112.44 / 111.48 |
| RSI (14) / Stochastic %K | 66.9 / 95.5 |
| Bollinger %B / ATR | 111% / 5.54 |
| Support / Resistance 20 days | 95.80 / 125.20 |
| Data as of | 3 Agustus 2026 08:30 WIB |
Track Alibaba share price daily: live levels, support/resistance and our full Alibaba analysis history.



