AstraZeneca Stock Analysis: Drops 7.06%, RSI Oversold
On Agustus 5, 2026: price 11,740.00 GBp, trend downtrend, RSI 28.8, support 11,500.00, resistance 14,364.00. technical analysis of astrazeneca stock.
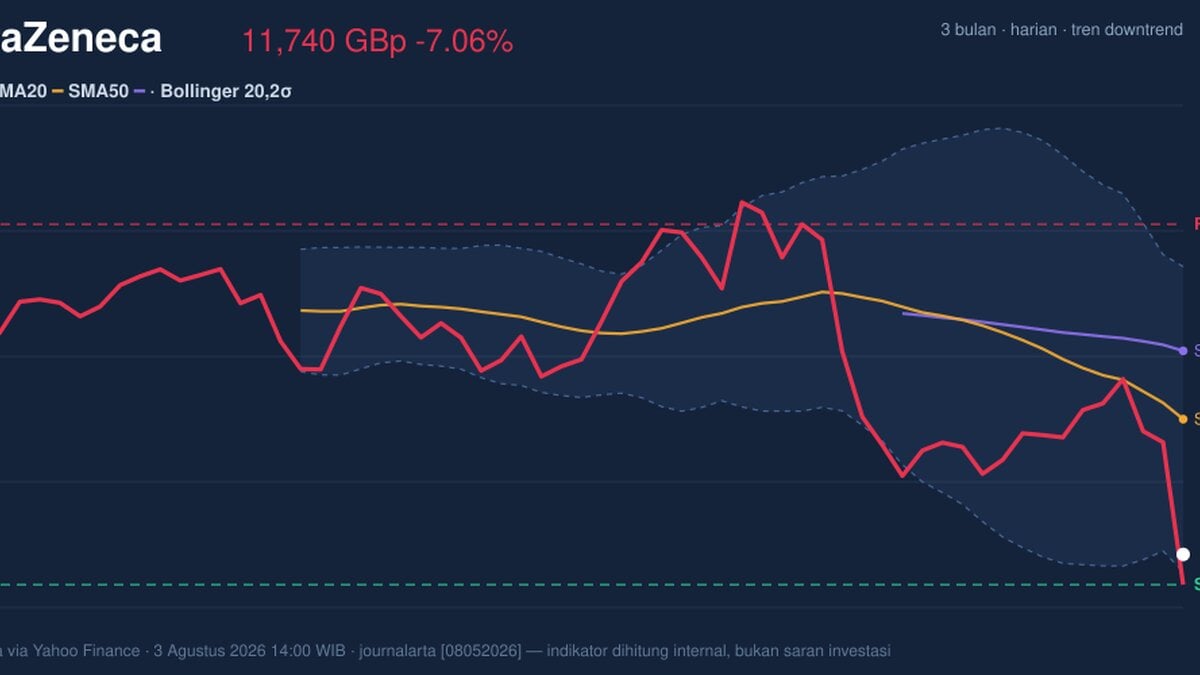
AstraZeneca shares on the LSE fell to 11,740.00 GBp as of 3 August 2026, down 7.06% on the day, after a weaker close of 12,632.00 the previous session, according to exchange-linked market data via Yahoo Finance. The move keeps the stock under pressure across multiple timeframes, with a 1-month decline of 16.74% and the price now sitting below both the SMA20 at 12,815.00 and the SMA50 at 13,357.64. That matters because when price trades under both short- and medium-term averages, the market is signalling that rallies are being sold into rather than treated as a fresh trend reversal.
Trend & Price Action
The chart shows a stock still defined by a downtrend, with the SMA20 slope at -3.07% over 5 days, which means the short-term average itself is rolling lower rather than flattening out. That is an important distinction. A falling moving average often tells traders that recent weakness is not just a one-day event but part of a broader deterioration in price structure.
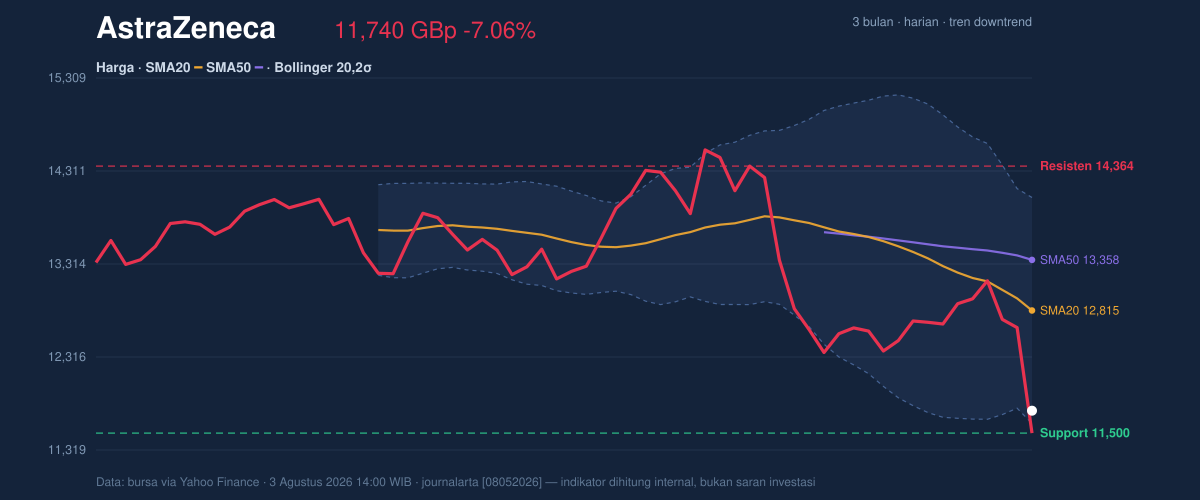
The current price is also positioned near the lower end of the recent trading band, at just 8% of the 20-hour range between 11,500.00 support and 14,364.00 resistance. In plain language, the market is close to the lower boundary of where it has been willing to trade recently. That can attract bargain-hunting interest, but it can also mean the stock is vulnerable if support gives way, because there is less room below before the next leg of weakness becomes visible.
The broader three-month range helps frame the move. AstraZeneca has traded between 9,892.00 and 15,126.00 over that period, so the current level is not at the extreme low, but it is clearly leaning toward the weaker side of the band. The absence of a new MA-cross shows there is no fresh moving-average crossover to argue that the trend has decisively turned.
Oscillators & Momentum
Momentum indicators are sending a mixed but still cautious message. The RSI at 28.8 is in oversold territory, which often means selling has been fast enough to stretch the stock beyond normal short-term conditions. But oversold does not mean a rebound is guaranteed. It simply means the market may be more prone to a pause or bounce if sellers lose conviction.
The stochastic oscillator is less supportive of an immediate reversal. With %K at 49.1 and %D at 73.1, the signal is neutral rather than bullish, and it suggests the faster line has not yet reclaimed clear upward momentum. That leaves the stock in a limbo zone: oversold on RSI, but not yet showing the kind of synchronized oscillator turn that usually confirms a durable recovery.
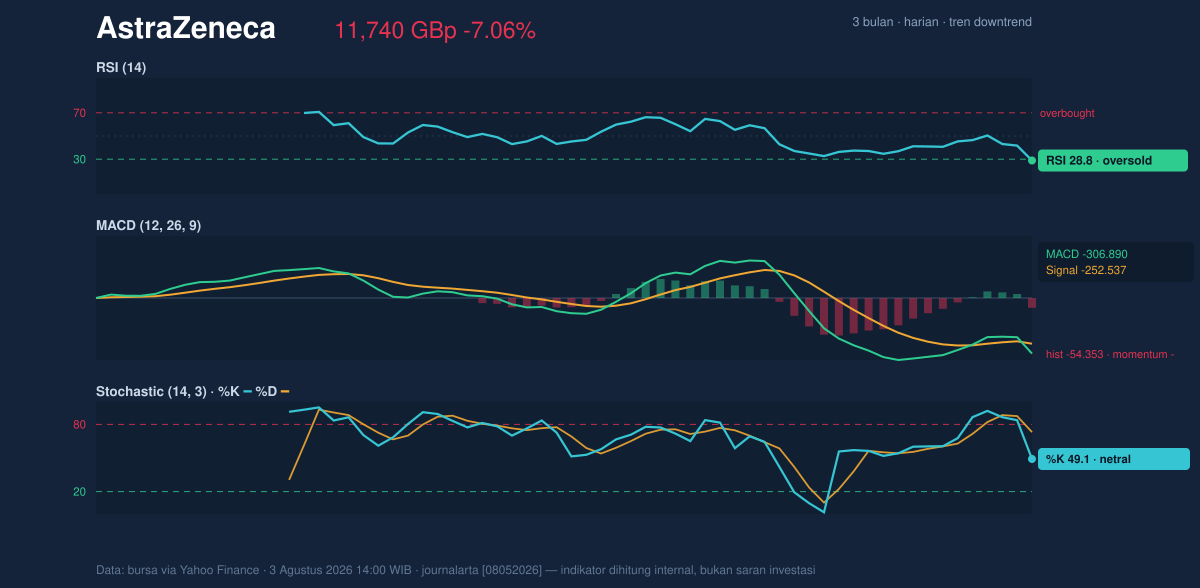
The MACD at -306.890 remains below its signal line at -252.537, with a histogram of -54.353. That negative histogram is the clearest momentum warning in the set. It means the gap between the MACD line and its signal remains unfavorable, so downside momentum still dominates even after the recent selloff. In practical terms, the stock is oversold, but not yet repaired.
Volatility & Volume
Volatility is elevated. The ATR(14) at 710.22, equal to 6.0% of price, indicates that daily swings are large enough to matter. ATR, or average true range, is a measure of how much the stock tends to move in a session; at this level, traders should expect wider intraday moves and a higher chance of sharp tests of support or resistance.
The Bollinger Bands add another layer. Price is near the lower band at 11,602.56, with the middle band at 12,815.00 and the upper band at 14,027.44. The %B at 6% shows the stock is trading very close to the lower edge of the band structure, a sign of weakness but also of a stretched condition. The 18.9% band width is described as normal, which means this is not a volatility squeeze waiting for a breakout; instead, the market is already moving with enough room for continuation in either direction.
Volume is the key confirmation point. Last volume came in at 13,543,538, roughly 3.9x the 20-hour average of 3,505,176. That is a strong participation signal, and in a down move it usually suggests the selling was not thin or accidental. The fact that OBV is down reinforces that reading. On-balance volume tracks whether volume is flowing into up days or down days; a falling OBV means the broader accumulation pattern is not yet improving.
Key Levels & Scenarios
The nearest support to watch is 11,500.00. That level is important because it sits just below the current price and lines up with the recent range floor. If it holds, the stock could attempt a mean-reversion move toward the middle Bollinger band at 12,815.00, where the short-term average also sits. If that zone is reclaimed, the next technical checkpoint is the 13,357.64 SMA50, followed by 14,027.44 and then 14,364.00 resistance.
If 11,500.00 fails, the technical picture weakens further because the market would be breaking beneath the immediate range base while momentum remains negative. In that case, the recent low area around 9,892.00 becomes the next reference point from the three-month range.
The message from the chart is straightforward: the stock is stretched, but not yet technically healed, and the burden remains on price to prove that the recent bounce attempt is more than a reflex move.
Technical Verdict: HOLD (wait & see)
HOLD (wait & see)
- RSI at 28.8 shows oversold conditions, but the MACD remains negative, so momentum has not fully turned.
- Price is still below the SMA20 at 12,815.00 and SMA50 at 13,357.64, keeping the trend structure weak.
- The 3.9x volume spike confirms heavy participation in the selloff, while OBV is down, which argues against immediate accumulation.
- Verdict invalidated if price breaks below 11,500.00.
- Ideal Entry Range: 11,500.00 to 11,602.56
- Exit Target: 12,815.00, then 13,357.64
- Stop Loss protection: below 11,500.00
For non-traders, this means the stock is weak but oversold, so the chart is waiting for proof that sellers are losing control rather than assuming it. The latest recorded support level is 11,500.00.
Summary Data AstraZeneca
| Last price | 11,740.00 GBp |
| Change 1 day / 5 days / 1 month | -7.06% / -8.91% / -16.74% |
| Trend / MA-cross | downtrend / none |
| SMA20 / SMA50 | 12,815.00 / 13,357.64 |
| RSI (14) / Stochastic %K | 28.8 / 49.1 |
| Bollinger %B / ATR | 6% / 710.22 |
| Support / Resistance 20 days | 11,500.00 / 14,364.00 |
| Data as of | 3 Agustus 2026 14:00 WIB |
Track AstraZeneca share price daily: live levels, support/resistance and our full AstraZeneca analysis history.



