DBS RSI Overbought: Stock Gains 0.65% (Agustus 5, 2026)
On Agustus 5, 2026: price 74.50 SGD, trend uptrend, RSI 71.5, support 68.64, resistance 75.00. technical analysis of dbs stock. DBS RSI Overbought — full…
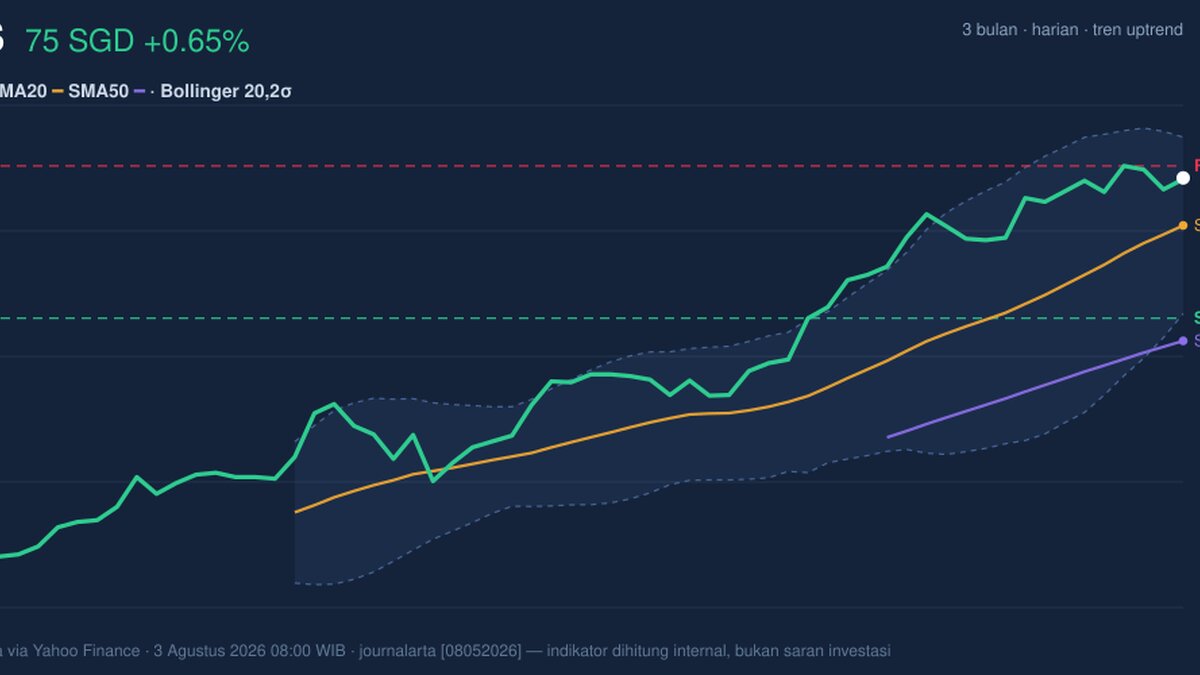
DBS Group’s shares were last quoted at 74.50 SGD, up 0.65% from the previous close, and now sit just below the 75.00 SGD resistance that has capped the stock over the past 3 months. The move keeps DBS in a clear uptrend, but the chart is also flashing a warning: momentum is stretched, volume is light, and the stock is trading close to the top of its recent range. As shown in the chart, the price is still above both key moving averages, yet the latest oscillators suggest the rally may need a pause before it can extend further.
Trend & Price Action
DBS remains technically constructive. The share price is above the SMA20 at 72.51 SGD and well above the SMA50 at 67.69 SGD, which is the classic sign of an established uptrend rather than a short-lived bounce. The SMA20 slope of 2.93% over 5 days shows the shorter trend is still rising, so the market is not merely drifting sideways; it is still climbing. That matters because rising short-term averages usually mean buyers have been willing to pay up even after small pullbacks.
The catch is where the price now stands in that structure. At 74.50 SGD, DBS is trading at 92% of its 20-hour range, very near the 75.00 SGD ceiling and the 3-month high of 75.00 SGD. In plain terms, the stock is pressing against an area where sellers have recently shown up. When a share is this close to the top of its range, the next move often depends less on trend direction and more on whether buyers can absorb supply at the top.
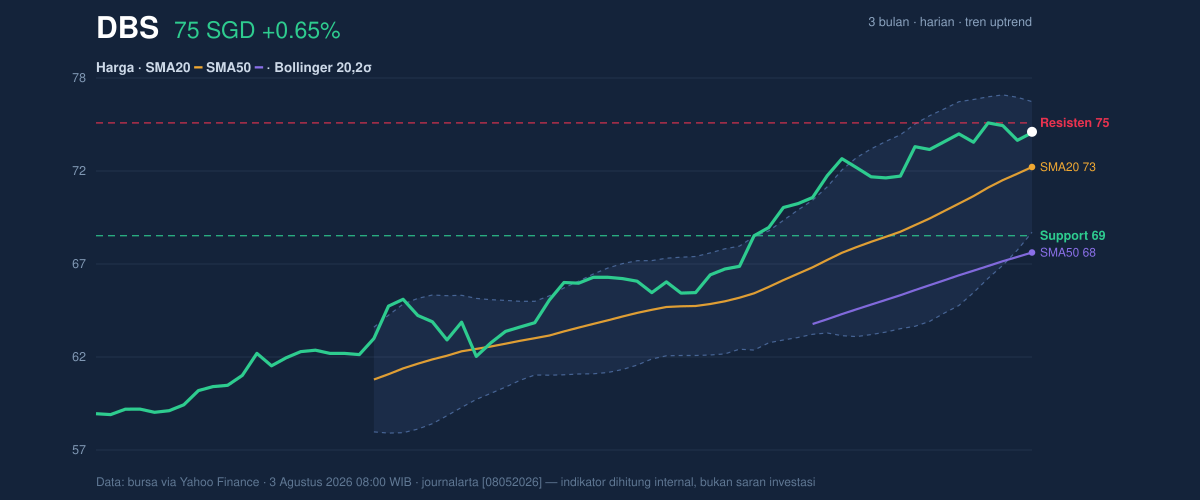
The Bollinger Bands reinforce that picture. Price is above the middle band at 72.51 SGD and below the upper band at 76.20 SGD, with %B at 77%. That means DBS is trading in the upper part of its recent volatility envelope, but not at an extreme breakout level. The 10.2% band width is normal, which suggests the stock is not in a volatility squeeze; instead, it is moving in a steady, orderly trend. That usually gives room for continuation, but only if momentum confirms.
Oscillators & Momentum
This is where the message turns more cautious. The RSI at 71.5 is in overbought territory, and the Stochastic %K at 84.8 and %D at 87.0 are also overbought. For general readers, overbought does not mean the stock must fall; it means the recent pace of buying has been strong enough that the move may be vulnerable to a pause or a shallow pullback. In a stock already near resistance, that warning becomes more relevant.
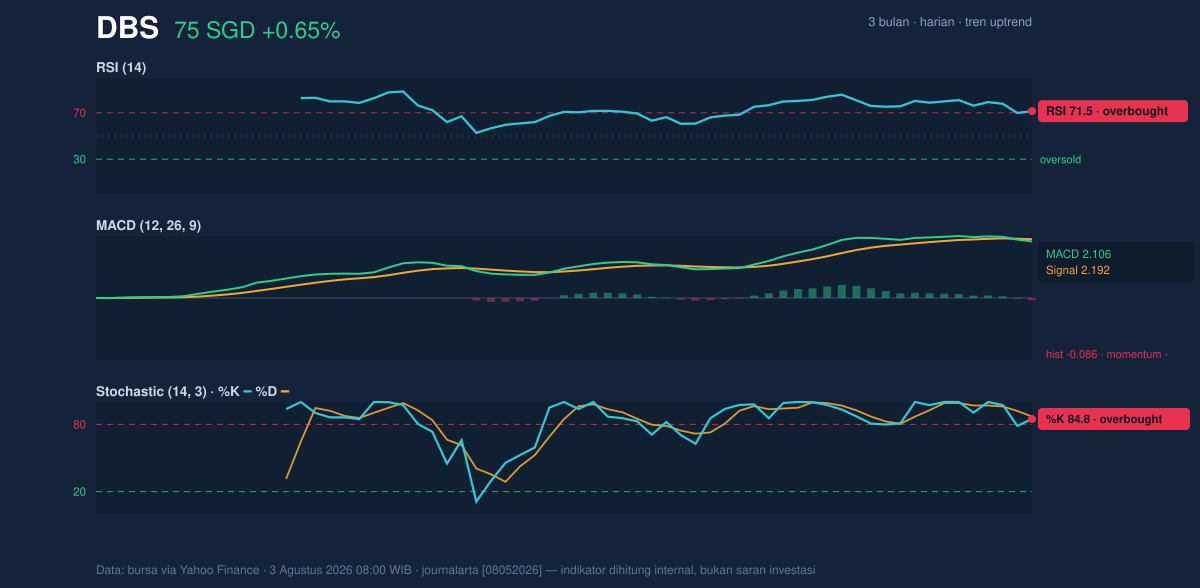
The MACD at 2.106 remains above zero, which keeps the broader trend positive, but it is now below the signal line at 2.192 and the histogram at -0.086 has turned negative. That combination matters because MACD is a trend-following tool: when the line slips under its signal, it often means upward momentum is losing force even if the price has not yet broken down. Put simply, DBS is still trending up, but the engine is no longer accelerating.
That divergence between price strength and weakening momentum is the key signal in this setup.
Volatility & Volume
The ATR at 1.12, or 1.5% of price, points to moderate day-to-day movement. This is not a stock behaving erratically; it is advancing with controlled swings. Moderate ATR can be healthy in an uptrend because it suggests the market is still tradable and not overstretched by panic spikes. But combined with overbought oscillators, it also implies that any break above resistance may not come with explosive follow-through unless volume improves.
Volume is the other caution flag. The latest print of 3,322,920 shares is only 0.7× normal versus the 20-day average of 4,479,822. That tells us the push toward resistance is not being backed by broad participation. Breakouts tend to be more credible when volume expands; thin volume often means the move is being carried by a smaller group of traders. Still, OBV is rising, which is constructive because on-balance volume tracks whether money has generally been flowing into the stock. So the participation picture is mixed: the recent session was quiet, but the broader volume trend has not broken down.
Key Levels & Scenarios
The market is now boxed in by a relatively tight decision zone. On the downside, 68.64 SGD is the key support from the 20-hour range and also sits below the Bollinger middle band at 72.51 SGD. If DBS loses that area, the chart would begin to look less like a controlled uptrend and more like a failed push at the highs. On the upside, 75.00 SGD is the immediate resistance and the 3-month high; clearing it would be the clearest signal that the stock is escaping the recent ceiling.
If price can sustain above 75.00 SGD, the upper Bollinger band at 76.20 SGD becomes the next technical reference. If it fails to hold the current level, the first meaningful test is back toward 72.51 SGD, where the short-term trendline support sits.
Technical Verdict: HOLD (wait & see)
HOLD (wait & see)
- RSI at 71.5 and Stochastic at 84.8 / 87.0 show the stock is overbought, so upside may be running ahead of immediate momentum.
- MACD is still positive but the histogram is -0.086, which signals fading near-term momentum even as the broader trend stays intact.
- Price above SMA20 and SMA50 keeps the trend constructive, but the share is already pressing the 75.00 SGD resistance with only 0.7× normal volume behind the move.
Verdict invalidated if price breaks below 68.64 SGD.
- Ideal Entry Range: 72.51 SGD to 68.83 SGD
- Exit Target: 75.00 SGD to 76.20 SGD
- Stop Loss protection: 68.64 SGD
For non-traders: DBS still looks strong, but the chart says the stock is pausing at a familiar ceiling rather than charging through it.
“The message from the chart is simple: the trend is alive, but the next step needs proof.”
Summary Data DBS
| Last price | 74.50 SGD |
| Change 1 day / 5 days / 1 month | 0.65% / 0.16% / 11.34% |
| Trend / MA-cross | uptrend / none |
| SMA20 / SMA50 | 72.51 / 67.69 |
| RSI (14) / Stochastic %K | 71.5 / 84.8 |
| Bollinger %B / ATR | 77% / 1.12 |
| Support / Resistance 20 days | 68.64 / 75.00 |
| Data as of | 3 Agustus 2026 08:00 WIB |
Track DBS share price daily: live levels, support/resistance and our full DBS analysis history.



