HSBC Stock Analysis: Drops 1.01%, RSI Overbought
On Agustus 5, 2026: price 166.50 HKD, trend uptrend, RSI 79.5, support 151.90, resistance 168.20. technical analysis of hsbc stock. HSBC Stock Analysis — full…
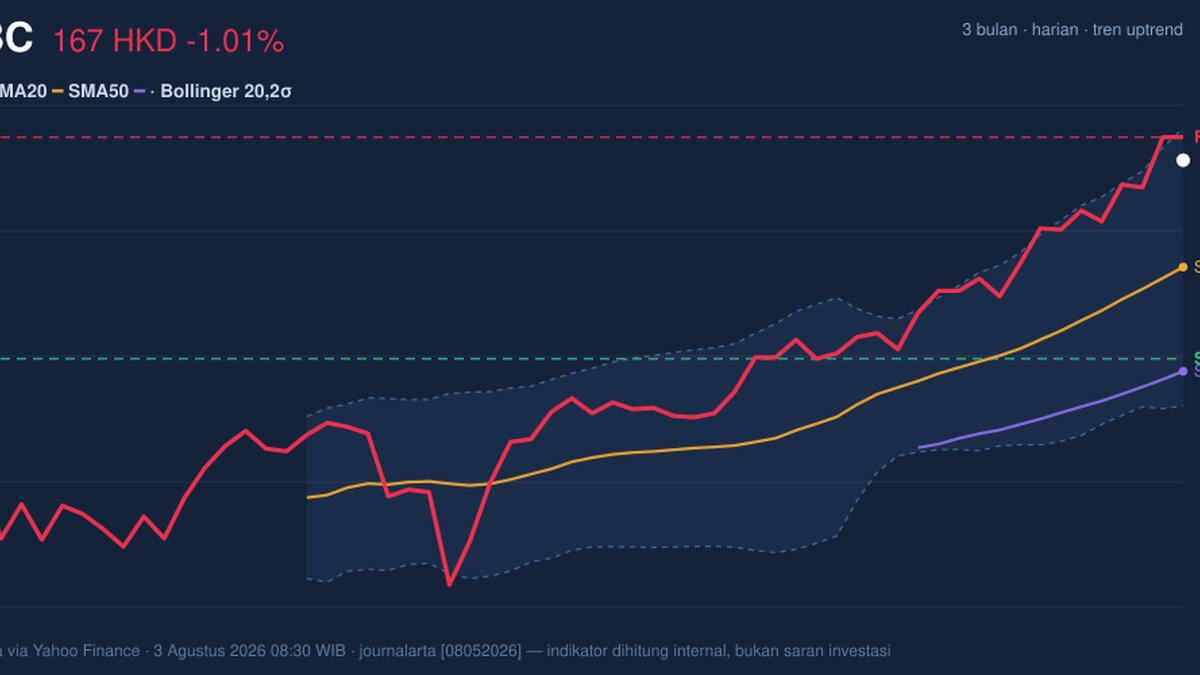
HSBC Holdings closed at 166.50 HKD, down 1.01% from the previous close of 168.20, but the bigger story is that the stock is still pressing near the top of its recent range. As shown in the chart, the shares sit well above both the SMA20 at 158.65 and the SMA50 at 150.99, which keeps the broader structure in an uptrend even after today’s pullback. The catch is momentum: short-term indicators are flashing stretched conditions, so the market is advancing, but it is doing so with less room to run before traders start testing the strength of the move.
Trend & Price Action
The price structure remains constructive. HSBC is trading above the SMA20 and SMA50, and the SMA20 slope of 2.54% over 5 days shows the shorter trend is still rising rather than flattening out. That matters because a rising 20-day average usually signals that recent buying has been persistent enough to lift the baseline of the market. The absence of a fresh MA-cross means there is no new crossover event to reframe the trend; instead, the stock is extending an already-established uptrend. With the last price sitting at about 90% of the 20-hour range and just below the 3-month high of 168.90, the chart suggests HSBC is trading close to a ceiling rather than in a neutral middle zone.
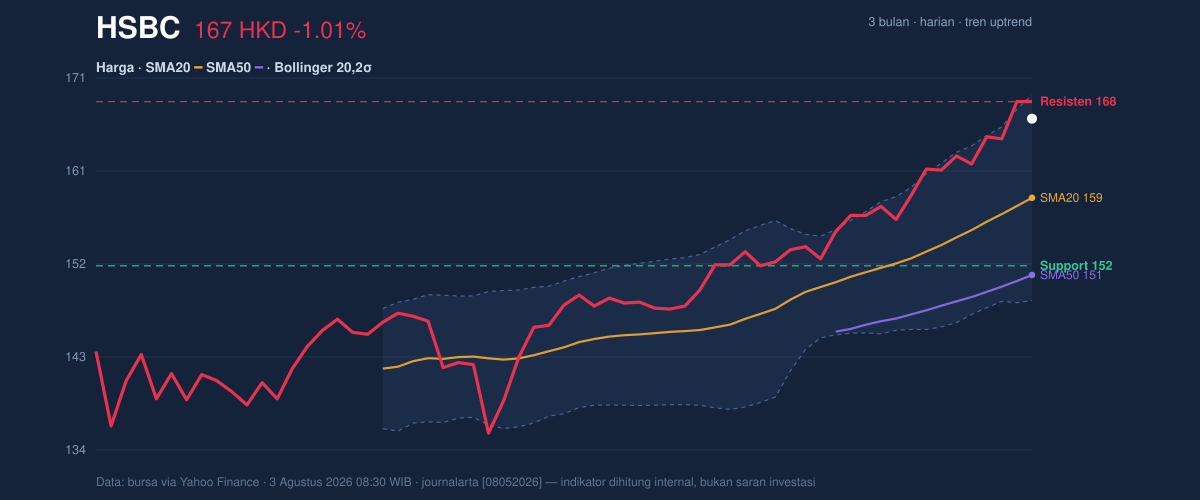
The market is not showing breakdown behavior; it is showing compression near resistance. That distinction is important. A stock can remain in an uptrend while still pausing under a nearby high, and that is the current setup here.
Oscillators & Momentum
Momentum is where the story becomes more nuanced. The RSI at 79.5 and the Stochastic %K at 95.1 / %D at 96.6 both point to overbought conditions, meaning the stock has risen fast enough that short-term traders may already be crowded in. In plain language, overbought does not automatically mean a reversal is imminent; it means the move has become extended and is more vulnerable to pauses, sideways trading, or a pullback if fresh demand slows. At the same time, the MACD at 4.678 remains above its signal line at 3.937, with a positive histogram of 0.741. That combination says trend momentum is still positive even though the oscillators are warning that the pace is stretched.
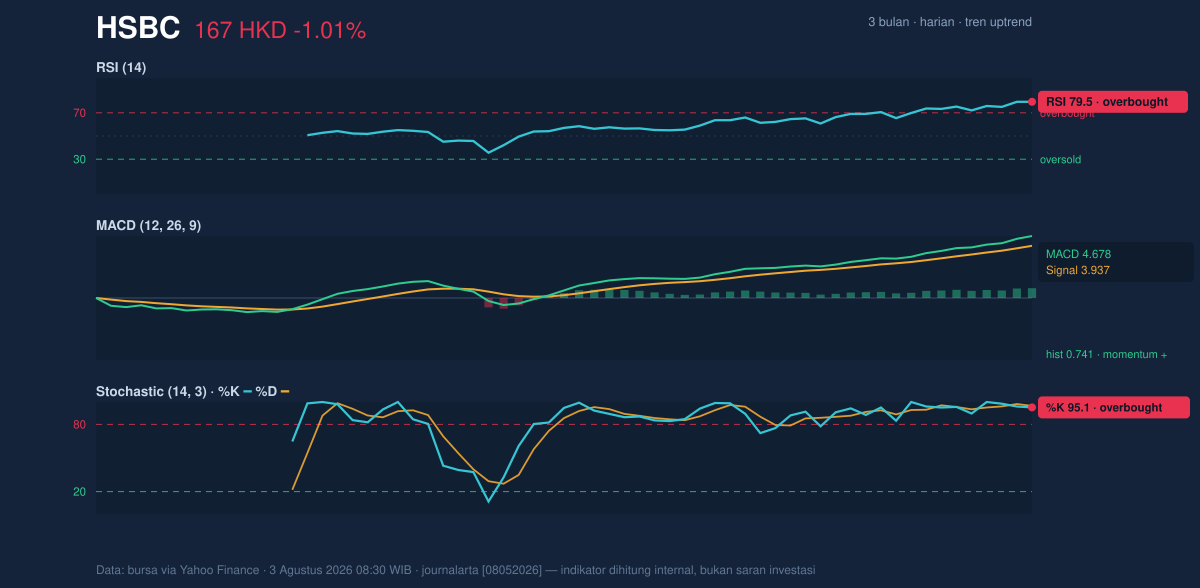
This is a classic split-screen setup: trend-following indicators are supportive, while oscillators are cautioning that the stock is near an exhaustion zone. When both are true at once, the market often needs either a brief consolidation or a fresh catalyst to justify another leg higher.
Volatility & Volume
Volatility is moderate rather than extreme. The ATR(14) of 2.88, equal to 1.7% of price, suggests the stock is still capable of daily movement, but not in a disorderly way. The Bollinger Bands frame that nicely: price is near the upper band at 168.86, with %B at 88% and a normal band width of 12.9%. A high %B means the stock is trading close to the top of its recent volatility envelope, which often happens when a trend is strong but can also precede mean reversion if the move becomes overextended. In other words, HSBC is not in a volatility squeeze that usually precedes a sharp breakout; it is already near the upper boundary of its current band structure.
Volume adds a cautionary note. Last trade volume was 12,417,142, below the 20-day average of 13,508,543, or about 0.9x normal. That means the latest push is happening without above-average participation. The OBV is rising, which is constructive because it implies cumulative buying pressure has been building over time, but the lighter session volume suggests the latest price level may not yet have broad enough support to force a clean breakout.
Key Levels & Scenarios
As shown in the chart, the immediate battle is between the support at 151.90 and the resistance at 168.20. The stock is currently trading close to that resistance and just under the 3-month high of 168.90, so the next move matters more than the last one. If HSBC can hold above the upper end of the recent range, the chart would likely stay in trend-extension mode. If it slips back through the mid-band area around the SMA20 at 158.65, that would suggest the recent rally is cooling rather than accelerating. A failure to defend 151.90 would be more serious, because it would put the stock back into the lower part of its range and weaken the current uptrend structure.
Technical Verdict: HOLD (wait & see)
HOLD (wait & see) because the trend is still positive, but the stock is also showing clear overbought pressure and is sitting close to resistance.
- MACD remains positive, so trend momentum has not broken.
- RSI at 79.5 and Stochastic at 95.1/96.6 warn that the move is extended.
- Price near 168.20 resistance and close to the 3-month high of 168.90 leaves limited near-term room before the chart needs a fresh catalyst.
Verdict invalidated if price falls below 151.90.
- Ideal Entry Range: 158.65 to 151.90
- Exit Target: 168.20 to 168.90
- Stop Loss protection: below 151.90
In plain English: the stock still looks technically healthy, but it is already stretched enough that the next move deserves patience rather than urgency.
HSBC’s latest close at 166.50 HKD sits just below the 168.20 resistance and the 168.90 three-month high.
Summary Data HSBC
| Last price | 166.50 HKD |
| Change 1 day / 5 days / 1 month | -1.01% / 2.27% / 9.54% |
| Trend / MA-cross | uptrend / none |
| SMA20 / SMA50 | 158.65 / 150.99 |
| RSI (14) / Stochastic %K | 79.5 / 95.1 |
| Bollinger %B / ATR | 88% / 2.88 |
| Support / Resistance 20 days | 151.90 / 168.20 |
| Data as of | 3 Agustus 2026 08:30 WIB |
Track HSBC share price daily: live levels, support/resistance and our full HSBC analysis history.



