HSBC Stock Analysis: Gains 0.55%, RSI Overbought
On Agustus 5, 2026: price 1,584.60 GBp, trend uptrend, RSI 74.0, support 1,453.40, resistance 1,597.40. technical analysis of hsbc stock.
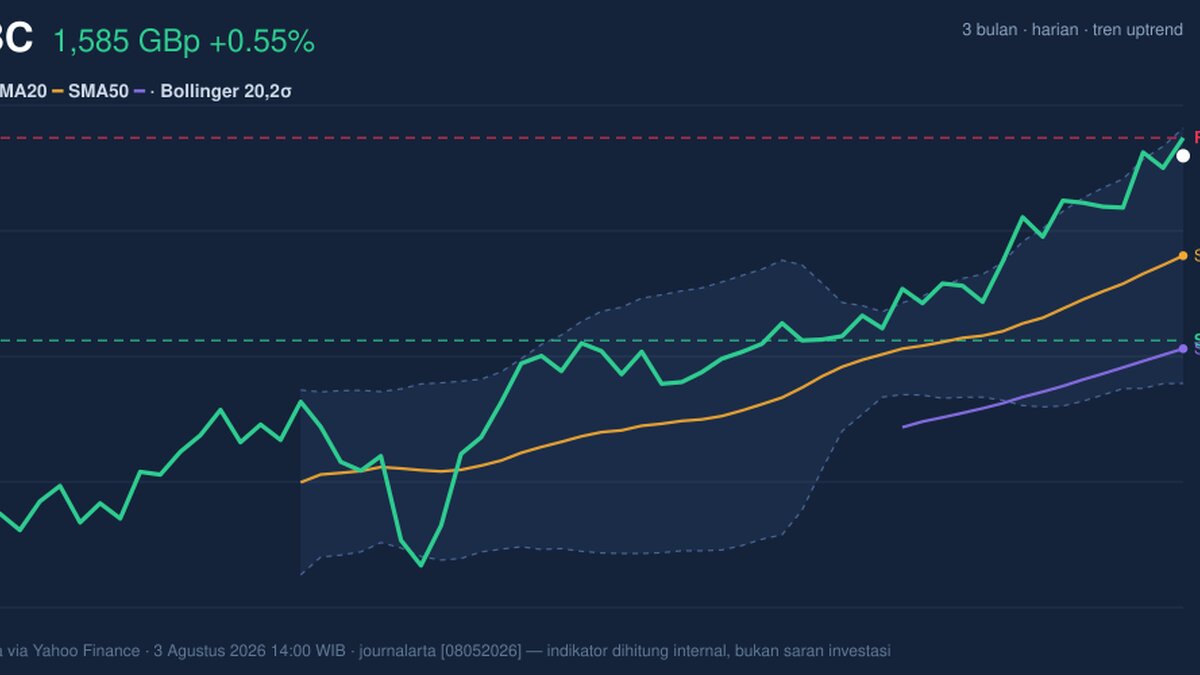
HSBC Holdings traded at 1,584.60 GBp on the LSE as of 3 August 2026 14:00 WIB, up 0.55% on the day and 8.12% over one month, with the shares now pressing into the upper end of their recent range. The message from the chart is straightforward: the stock is still in an uptrend, but it is also moving into territory where momentum is stretched, and that matters because strong trends often slow before they reverse.
Trend & Price Action
As shown in the chart, HSBC is trading above SMA20 at 1,513.57 and above SMA50 at 1,447.51, which keeps the broader structure constructive. The SMA20 is rising 2.10% over five days, a useful sign because a rising short-term average usually means recent buying is still outpacing selling. There is no new MA-cross, so the current advance is not being driven by a fresh crossover signal; instead, it is being carried by price holding above both moving averages. That typically tells traders the trend is already established rather than just beginning.
The stock is also sitting close to the top of its recent trading band. With a 20-hour resistance at 1,597.40 and a 20-hour support at 1,453.40, the current price is positioned near the upper boundary of that range, at roughly 91% of the range. In plain terms, HSBC is not just rising — it is rising after having already done much of the work. That can be constructive if buyers keep absorbing supply near resistance, but it also means the next move matters more than the last one.
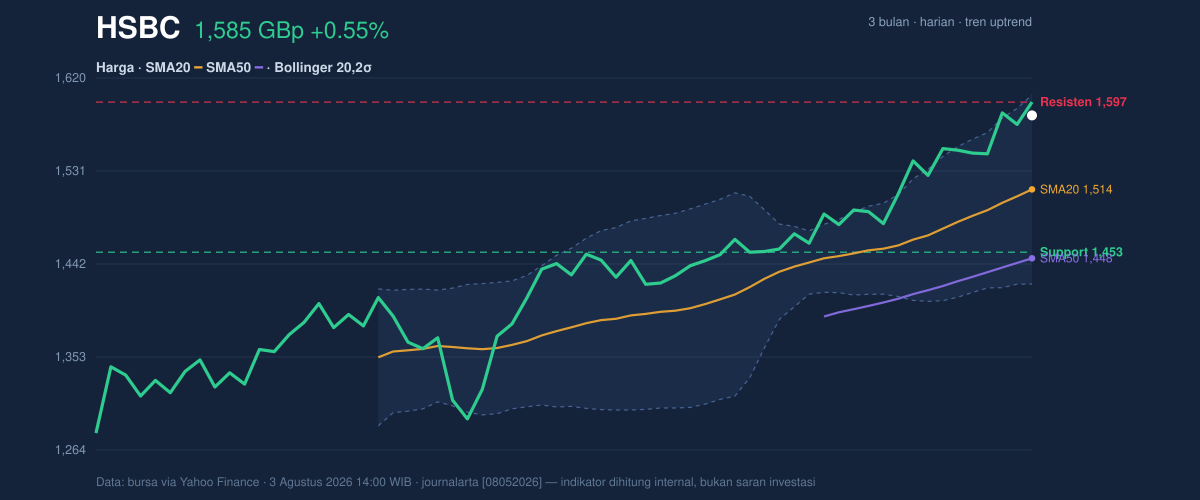
The broader three-month picture reinforces that point. The shares are still below the 3-month high of 1,604.60, but well above the 3-month low of 1,256.20. That leaves room for further upside within the existing trend, yet the proximity to the upper end of the range suggests the market is now testing whether this rally can extend or whether it needs to pause and consolidate.
Oscillators & Momentum
Momentum indicators are flashing a more cautious message even as price remains firm. The RSI at 74.0 is overbought, which does not mean the stock must fall, but it does mean recent gains have been fast enough to leave the shares vulnerable to a cooling phase. The Stochastic %K at 97.2 and %D at 94.1 are also overbought, and because both lines are near the top of their scale, they suggest the stock has been closing near its intraday highs for several sessions. That is a sign of strong buying pressure — but also of a market that may already be crowded on the long side.
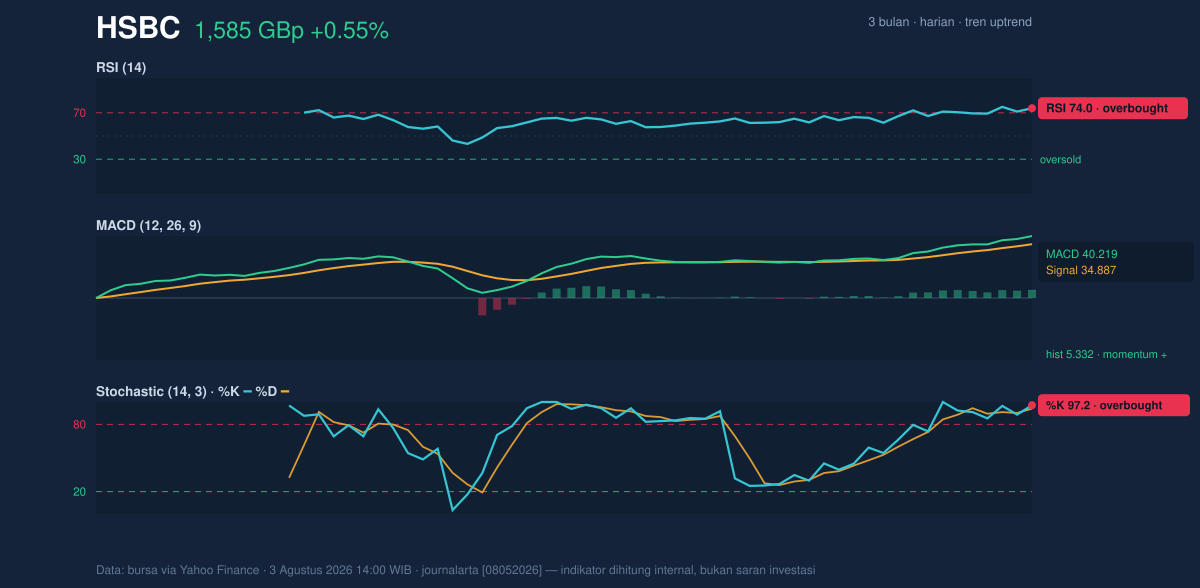
The MACD at 40.219, above its signal line at 34.887, with a positive histogram of 5.332, is the clearest confirmation that trend momentum is still pointing higher. MACD is useful because it measures whether short-term price strength is outrunning longer-term strength, and here the answer is yes. The signals are aligned in the bullish direction, but they are not perfectly comfortable: strong MACD plus overbought RSI and Stochastic often means the trend is healthy, yet extended. That combination usually favors continuation only if price can keep closing near resistance without a sharp drop in participation.
Volatility & Volume
Volatility is present, but not extreme. The ATR(14) of 37.73, equal to 2.4% of price, points to moderate volatility, meaning daily swings are large enough to matter but not so wild that the chart is disorderly. That matters because a stock with moderate volatility and a strong trend can grind higher more reliably than one being whipped around by oversized moves. The Bollinger Band width of 12.0% is described as normal, so this is not a squeeze building up for a dramatic breakout; instead, the market is already in a fairly standard expansion phase. Price at %B 89% means HSBC is trading close to the upper Bollinger band at 1,604.27, another sign of strength, but also another sign that the upside may need fresh momentum to continue.
Volume adds a more nuanced layer. Last volume was 31,298,160, about 1.5× the 20-hour average of 20,888,299, which confirms that the move is not happening on thin trading. Higher volume usually improves the credibility of a trend because more market participants are involved. Yet OBV is down, and that divergence matters: on-balance volume tracks whether volume is supporting the direction of price over time, so a falling OBV while price rises can hint that the rally is not being confirmed as cleanly as the headline price action suggests. In other words, buyers are active, but the longer-term participation signal is less convincing than the day’s volume alone would imply.
Key Levels & Scenarios
The immediate battleground is clear. Resistance at 1,597.40 sits just above the current price, while the next obvious ceiling is the 3-month high at 1,604.60. If HSBC can hold above the current area and clear those levels, the chart would be signaling that the market is willing to price in a fresh leg of the existing trend. If it fails there, the likely reaction is not a collapse but a drift back toward the SMA20 at 1,513.57, which now acts as the first meaningful trend test. Below that, the 20-hour support at 1,453.40 becomes the key line that would tell traders the recent advance has lost traction.
The important signal is not just where the stock is, but how it behaves near the top of the range. Strong trends can stay overbought for a while, but when RSI, Stochastic, and Bollinger positioning all stretch together, the market is usually asking for proof that buyers still have the conviction to keep pushing.
Technical Verdict: HOLD (wait & see)
- RSI at 74.0 and Stochastic %K 97.2 / %D 94.1 show the shares are overbought, which raises the risk of a pause even though the trend remains positive.
- MACD remains bullish at 40.219 versus 34.887, and price is still above SMA20 and SMA50, so the underlying trend has not broken.
- Volume is 1.5× normal, but OBV is down, so participation is supportive in the short run but not fully confirming the advance.
- Verdict invalidated if price falls below 1,453.40, the 20-hour support that currently protects the trend structure.
Ideal Entry Range: 1,513.57 to 1,453.40, where the SMA20 and support area offer the clearest technical backing.
Exit Target: 1,597.40 to 1,604.60, matching near resistance and the 3-month high.
Stop Loss Protection: below 1,453.40, because a break there would weaken the current uptrend structure.
In plain English: HSBC is still rising, but the chart says the stock is now close enough to resistance that it needs to prove the move can continue.
HSBC’s 3-month high stands at 1,604.60 GBp.
Summary Data HSBC
| Last price | 1,584.60 GBp |
| Change 1 day / 5 days / 1 month | 0.55% / 2.15% / 8.12% |
| Trend / MA-cross | uptrend / none |
| SMA20 / SMA50 | 1,513.57 / 1,447.51 |
| RSI (14) / Stochastic %K | 74.0 / 97.2 |
| Bollinger %B / ATR | 89% / 37.73 |
| Support / Resistance 20 days | 1,453.40 / 1,597.40 |
| Data as of | 3 Agustus 2026 14:00 WIB |
Track HSBC share price daily: live levels, support/resistance and our full HSBC analysis history.



