OCBC Momentum Weakens: Stock Drops 1.41% (Agustus 5, 2026)
On Agustus 5, 2026: price 28.72 SGD, trend uptrend, RSI 63.7, support 26.34, resistance 29.78. technical analysis of ocbc stock. OCBC Momentum Weakens — full…
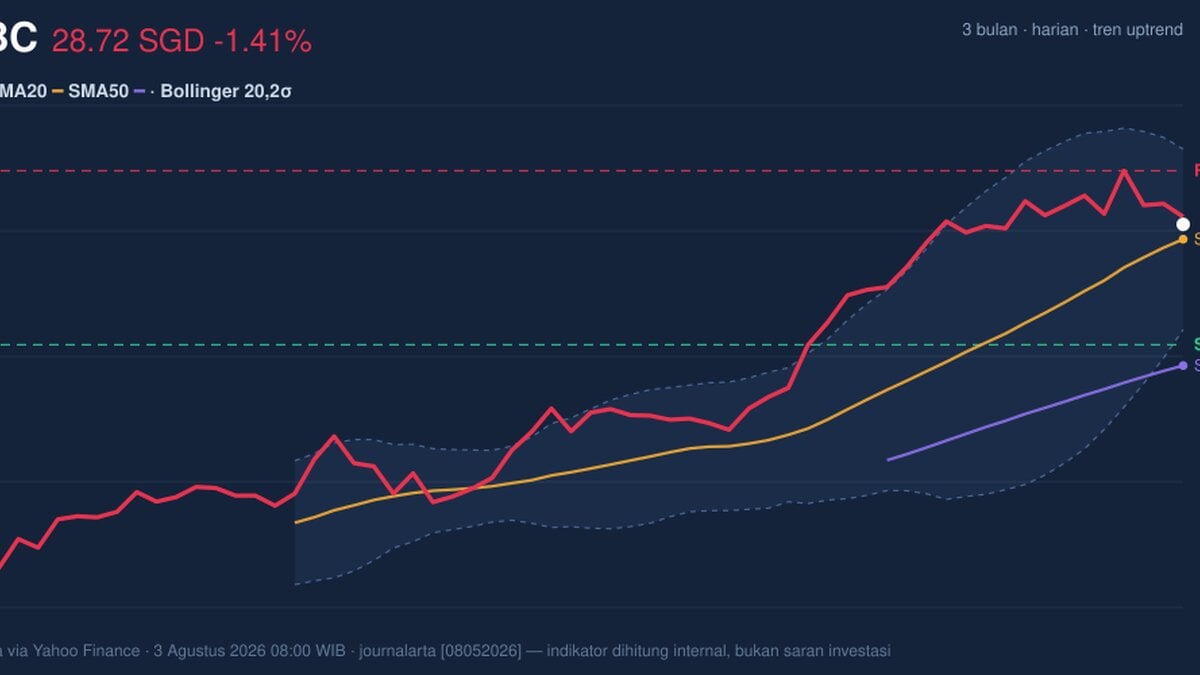
OCBC Bank slipped 1.41% to 28.72 SGD in the latest session, according to SGX data relayed through Yahoo Finance, even though the stock still sits above its short- and medium-term moving averages. That makes the day’s decline look less like a trend break and more like a pause inside a broader advance. The catch is that the tape is no longer cleanly one-way: momentum is cooling, volume is only ordinary, and the stock is now pressing into the upper half of its recent range rather than breaking away from it.
Trend & Price Action
The chart shows OCBC still in an uptrend, with the SMA20 at 28.43 rising at a 3.74% pace over five days and the share price staying above the SMA20. That matters because a rising short-term average usually signals that recent buying interest has been strong enough to lift the baseline of trading. The SMA50 at 25.93 sits well below the current price, which confirms the longer swing has already turned constructive. There is no fresh MA cross, so the market is not receiving a new trend-acceleration signal; instead, it is digesting prior gains.
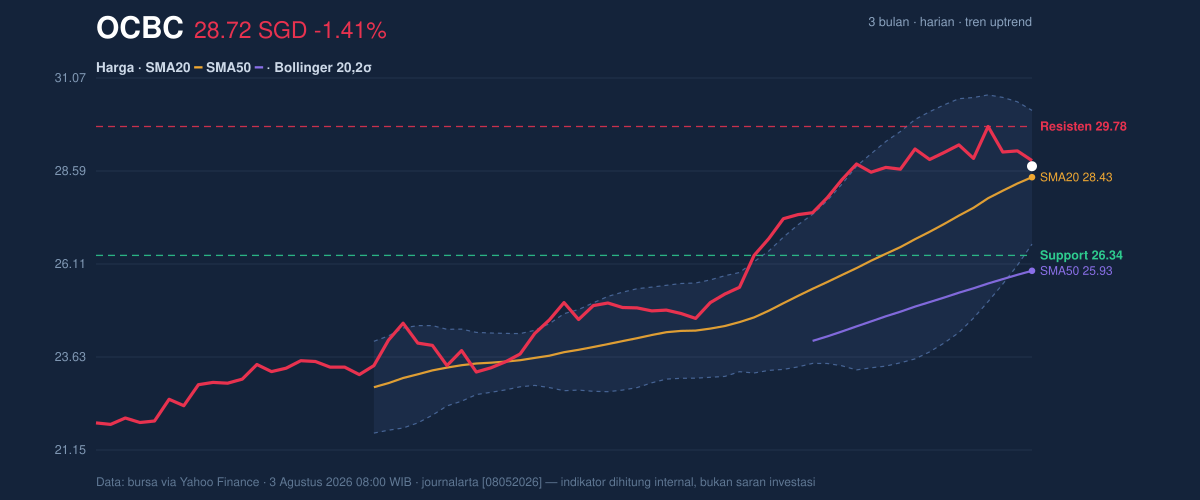
What stands out is where the stock is trading inside its recent corridor. At 28.72, OCBC is sitting at 69% of the 20-hour range between 26.34 support and 29.78 resistance. In plain terms, the share is closer to the top of the box than the bottom, which often means buyers remain in control but have less room before running into supply. The three-month high of 29.78 now acts as a visible ceiling; the three-month low of 21.65 shows how far the stock has already recovered. The latest close below the previous 29.13 also hints that traders are testing whether the recent advance can hold its pace without fresh catalysts.
Oscillators & Momentum
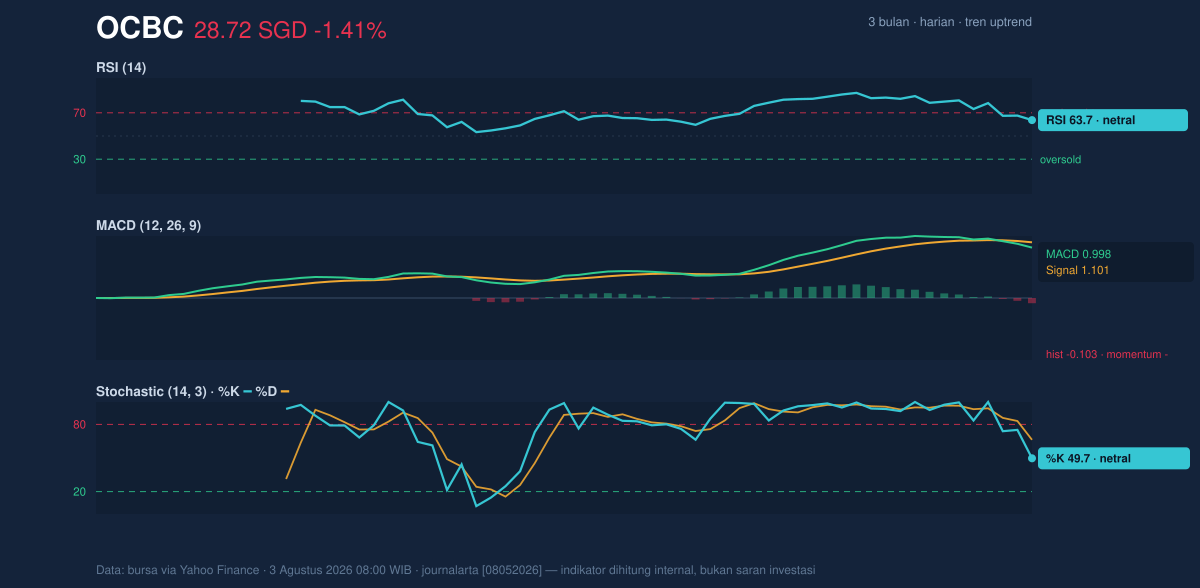
The momentum picture is mixed, and that is the most important signal in the set. The RSI at 63.7 is still neutral, which means the stock is not yet in a classic overbought zone, but it is close enough to the upper band to suggest the move has already used up some energy. The Stochastic %K at 49.7 and %D at 66.3 are also neutral, but with %K below %D, the short-term rhythm is softer than the broader trend. That setup often tells readers that price is still elevated, yet the latest burst of enthusiasm is fading.
The clearest warning comes from the MACD. With the MACD at 0.998 below the signal at 1.101, and the histogram at -0.103, momentum has turned negative even while the price remains above key averages. In straightforward language, that means the trend has not broken, but the rate of ascent has slowed enough for the market to hesitate. When price is still firm and MACD is slipping, traders usually watch for either a fresh push through resistance or a drift back toward support.
Volatility & Volume
The Bollinger bands show a stock that is not stretched. With the upper band at 30.21, the middle band at 28.43, and the lower band at 26.64, OCBC is trading just above the centre line, while %B at 58% suggests it is neither pressed against the top nor collapsing toward the bottom. The 12.6% band width is described as normal, so there is no squeeze implying an imminent explosive move, and no expansion warning of disorderly volatility. That combination often points to a market that is still orderly, but waiting for a stronger trigger.
Volume supports that reading. The latest turnover of 6,583,500 was close to the 20-hour average of 6,886,175, or about 1.0× normal. That is enough to say the move is being traded, but not enough to call it decisive conviction. The more subtle clue is that OBV is down, which means cumulative volume flow has weakened even if the price has not yet rolled over. In technical terms, that is a mild divergence: price is still elevated, but participation has not fully confirmed the strength. The ATR(14) at 0.58, or 2.0% of price, points to moderate volatility, so swings are present but not extreme.
Key Levels & Scenarios
The immediate battle is between 26.34 support and 29.78 resistance. A sustained move above 29.78 would place the stock at the top of its 3-month range and would be the clearest sign that buyers are ready to extend the trend. If price fails to hold 28.43, the SMA20 and Bollinger middle band, the chart would start to look more like consolidation than continuation. A break below 26.64, the lower Bollinger band, would be a stronger warning that the recent advance is losing shape. The broader 3-month low at 21.65 remains the deeper reference point, but the nearer levels are the ones that matter first.
Technical Verdict: HOLD (wait & see)
HOLD (wait & see) fits the chart because the trend is still positive, but momentum is no longer confirming it cleanly. The price above SMA20 and SMA50 keeps the structure constructive. The MACD histogram at -0.103 warns that short-term momentum has turned negative. The normal Bollinger width and 1.0× volume suggest the market is pausing rather than launching a new leg.
- Ideal Entry Range: 26.64 to 28.43, where the lower Bollinger band and SMA20 may offer technical support.
- Exit Target (Target Price): 29.78 to 30.21, using the recent resistance and upper Bollinger band as reference zones.
- Stop Loss protection: below 26.34, with a stricter caution point at 26.64 if the lower band gives way.
The verdict is invalidated if price breaks below 26.34, because that would mean the nearest support has failed and the current uptrend is losing structure.
For non-traders, this means OCBC still looks technically firm, but the chart is asking for proof before the next move.
Summary Data OCBC
| Last price | 28.72 SGD |
| Change 1 day / 5 days / 1 month | -1.41% / -1.95% / 12.67% |
| Trend / MA-cross | uptrend / none |
| SMA20 / SMA50 | 28.43 / 25.93 |
| RSI (14) / Stochastic %K | 63.7 / 49.7 |
| Bollinger %B / ATR | 58% / 0.58 |
| Support / Resistance 20 days | 26.34 / 29.78 |
| Data as of | 3 Agustus 2026 08:00 WIB |
Track OCBC share price daily: live levels, support/resistance and our full OCBC analysis history.



