Singtel Stock Drops 0.23%, Golden Cross Formed In Focus
On Agustus 5, 2026: price 4.43 SGD, trend sideways, RSI 46.3, support 4.37, resistance 4.61. technical analysis of singtel stock. Singtel Stock Drops — full…
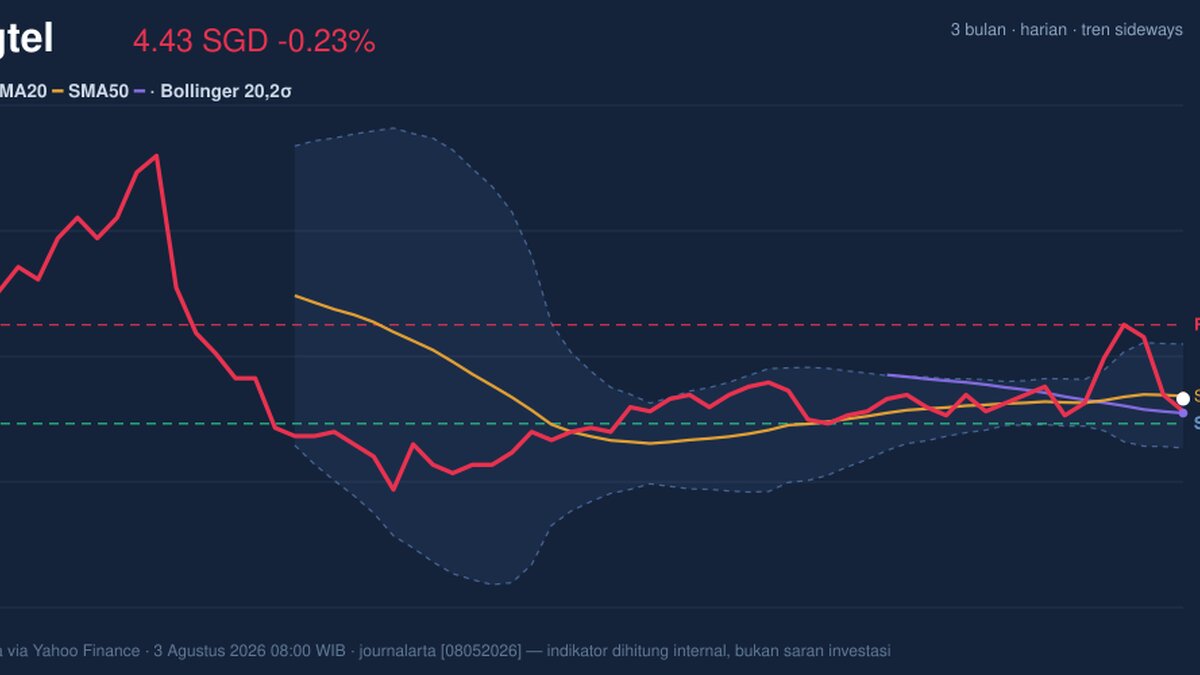
Singapore Telecom (Singtel) edged down to 4.43 SGD on SGX, slipping 0.23% from the previous close as the stock continues to trade in a narrow band rather than a decisive trend. The move matters less for its size than for what it says about positioning: the shares are sitting just below the short-term average, yet the broader setup is not bearish, with a golden cross still in place and momentum signals beginning to stabilize. In plain terms, the chart is showing a market that is pausing, not breaking.
Trend & Price Action
As shown in the chart, Singtel is in a sideways phase, with the SMA20 at 4.44 and the SMA50 at 4.40. Price is below the SMA20 but still above the longer average, which usually signals short-term hesitation inside a broader base rather than a clean downtrend. The golden cross — where the faster 20-day average has moved above the 50-day average — is important because it tells traders that the medium-term structure has improved, even if the latest candles have not yet confirmed follow-through.
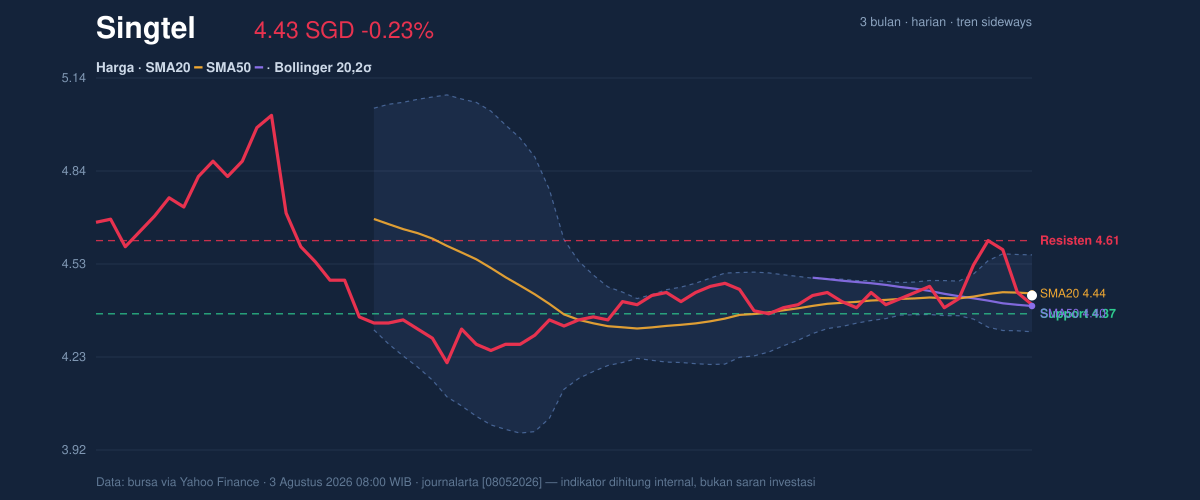
The stock is also trading near the lower half of its recent range, but not at an extreme. The 20-hour support at 4.37 sits close enough to matter, while 20-hour resistance at 4.61 remains the first meaningful ceiling. That places the current price in a fairly neutral zone: not weak enough to signal breakdown, but not strong enough to claim a breakout. The 3-month range of 5.05 to 4.15 shows the shares are still well below the upper end of the recent swing, which reinforces the idea that the market is rebuilding rather than trending aggressively.
Oscillators & Momentum
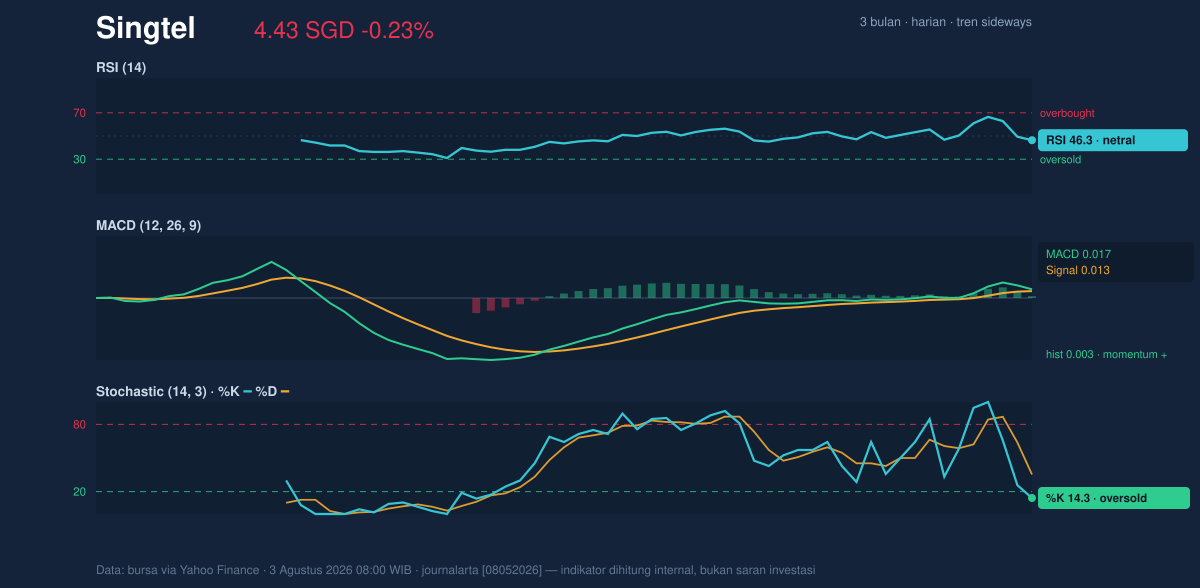
The oscillator mix is more constructive than the price action alone suggests. RSI at 46.3 is neutral, which means the stock is neither stretched to the upside nor oversold on a broad basis. That matters because neutral RSI often gives a trend room to develop if other indicators turn up. More telling is the Stochastic reading of 14.3 / 35.2, which points to an oversold short-term condition. Stochastic is a faster gauge than RSI, so this often means the stock has been sold enough in the near term that a bounce can emerge if buyers step back in.
The MACD at 0.017, above its signal line at 0.013, with a positive histogram of 0.003, adds a small but important confirmation. MACD measures whether short-term momentum is improving relative to the longer trend, and here it is. The signal is not strong enough to imply a sharp upswing on its own, but it does suggest that upward pressure is building underneath a flat price structure. Put together, the oscillators lean mildly positive: not a breakout call, but a sign that downside momentum has softened.
Volatility & Volume
The Bollinger Bands are tightening, with the upper band at 4.56, the middle band at 4.44, and the lower band at 4.31. The 5.7% band width is narrow, and that squeeze matters because compressed volatility often precedes a larger move. A squeeze does not tell direction, but it does tell you the market is coiling. With price sitting at 47% of the band range, Singtel is essentially parked near the midpoint, waiting for a catalyst or a shift in participation.
ATR(14) at 0.09, or 2.1% of price, says the daily range is still moderate. That means any breakout attempt is likely to unfold in measured steps rather than a dramatic gap. Volume adds a useful check: the latest turnover of 25,683,600 is only 0.8× normal versus the 20-hour average, so the recent move lacks strong conviction. Yet OBV — on-balance volume, a measure of whether volume is accumulating on up days — is rising, which suggests quiet accumulation is still in place even if headline volume has not surged. That combination often appears before a more decisive move, but not always immediately.
Key Levels & Scenarios
The chart points to a tight decision zone. 4.37 is the nearest support to watch, and 4.31 is the lower Bollinger band, which becomes the next technical reference if support gives way. On the upside, 4.56 marks the upper Bollinger band, while 4.61 is the first clear resistance. A push through that area would be more meaningful because it would move price beyond both the recent volatility envelope and the immediate supply zone.
If 4.37 holds, the oversold stochastic and positive MACD raise the odds of a rebound toward 4.56 and then 4.61. If 4.37 fails, the chart would likely lose its constructive tone and shift attention to 4.31 and the lower edge of the Bollinger band. The fact that the price is still above 4.40, the SMA50, means the longer short-term base has not been damaged yet. That is the key distinction: the stock is under mild pressure, but the larger technical structure remains intact.
Technical Verdict: HOLD (wait & see)
HOLD (wait & see)
- Golden cross between SMA20 and SMA50 keeps the medium-term structure constructive.
- MACD is positive and the Stochastic is oversold, which supports a rebound attempt.
- Bollinger Bands are squeezing, so a larger move may be building, but direction is not yet confirmed.
Verdict invalidated if price breaks below 4.37.
- Ideal Entry Range: 4.37 to 4.44
- Exit Target: 4.56 to 4.61
- Stop Loss protection: 4.31
For non-traders, this means Singtel’s chart is neither clearly weak nor clearly strong, and the next move should matter more than the last one.
Source: SGX via Yahoo Finance, 3 August 2026 08:00 WIB.
Summary Data Singtel
| Last price | 4.43 SGD |
| Change 1 day / 5 days / 1 month | -0.23% / 0.23% / -0.45% |
| Trend / MA-cross | sideways / golden |
| SMA20 / SMA50 | 4.44 / 4.40 |
| RSI (14) / Stochastic %K | 46.3 / 14.3 |
| Bollinger %B / ATR | 47% / 0.09 |
| Support / Resistance 20 days | 4.37 / 4.61 |
| Data as of | 3 Agustus 2026 08:00 WIB |
Track Singtel share price daily: live levels, support/resistance and our full Singtel analysis history.



