Tencent Stock Technicals Today: Gains 2.61%, Testing Key Resistance
On Agustus 5, 2026: price 487.60 HKD, trend uptrend, RSI 61.5, support 434.60, resistance 490.40. technical analysis of tencent stock. Tencent Stock Technicals…
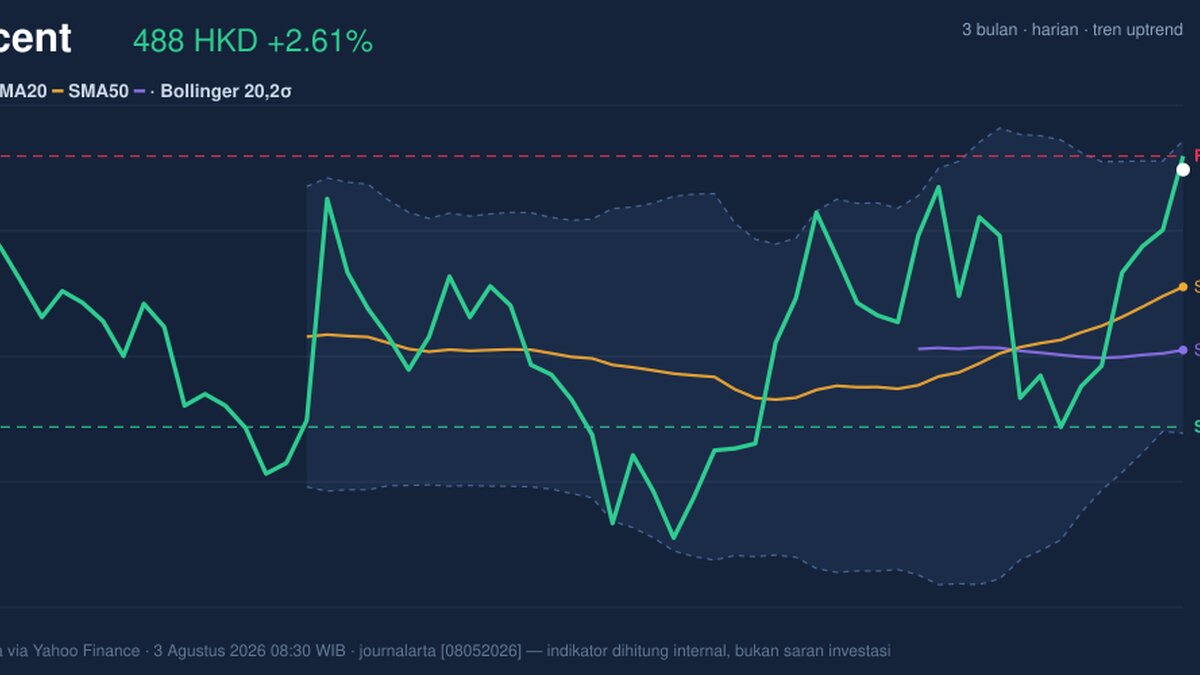
Tencent Holdings traded higher on the Hong Kong exchange on 3 August 2026, with 0700.HK last at 487.60 HKD, up 2.61% on the day and extending its 10.07% gain over 5 days, according to Yahoo Finance data via the exchange feed. The move leaves the stock just below the upper edge of its recent range, which matters because price strength near resistance can mean either steady accumulation or a market that is getting stretched.
The chart shows a stock that is still in an uptrend, with the SMA20 at 463.47 rising at 2.07% over 5 days and price holding above both the SMA20 and the SMA50 at 450.47. That alignment is constructive: when a shorter moving average sits above a longer one, it usually signals that recent buying has been strong enough to keep the trend intact. There is no fresh MA-cross, though, which means this is not a new technical breakout story so much as a trend that is being maintained. In plain terms, Tencent is not starting from scratch; it is working from an already positive base.
Trend & Price Action
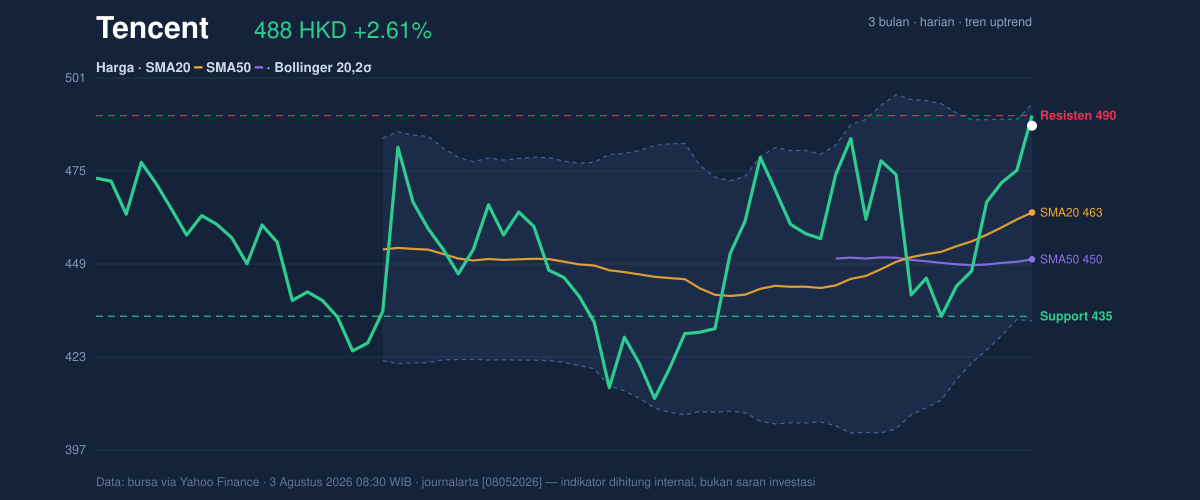
Price is now trading at 95% of the 20-hour range, with support at 434.60 and resistance at 490.40. That positioning is important: being near the top of the range can reflect demand, but it also narrows the margin for error because the stock has less room to absorb a pullback before traders start questioning the pace of the advance. The broader 3-month band, from 411.00 to 494.80, shows Tencent is approaching the upper end of its recent quarter-long corridor. That does not guarantee a reversal, but it does explain why the next move may be more about whether the stock can consolidate above current levels than about a clean acceleration from here.
The Bollinger Bands reinforce that message. With the upper band at 493.61 and price sitting at a %B of 90%, Tencent is trading close to the top of its volatility envelope. In simple language, the market has already priced in a lot of near-term enthusiasm. The band width is 13.0%, described as normal, so this is not a squeeze that typically precedes a violent expansion; instead, it suggests a regular but elevated trading environment.
Oscillators & Momentum
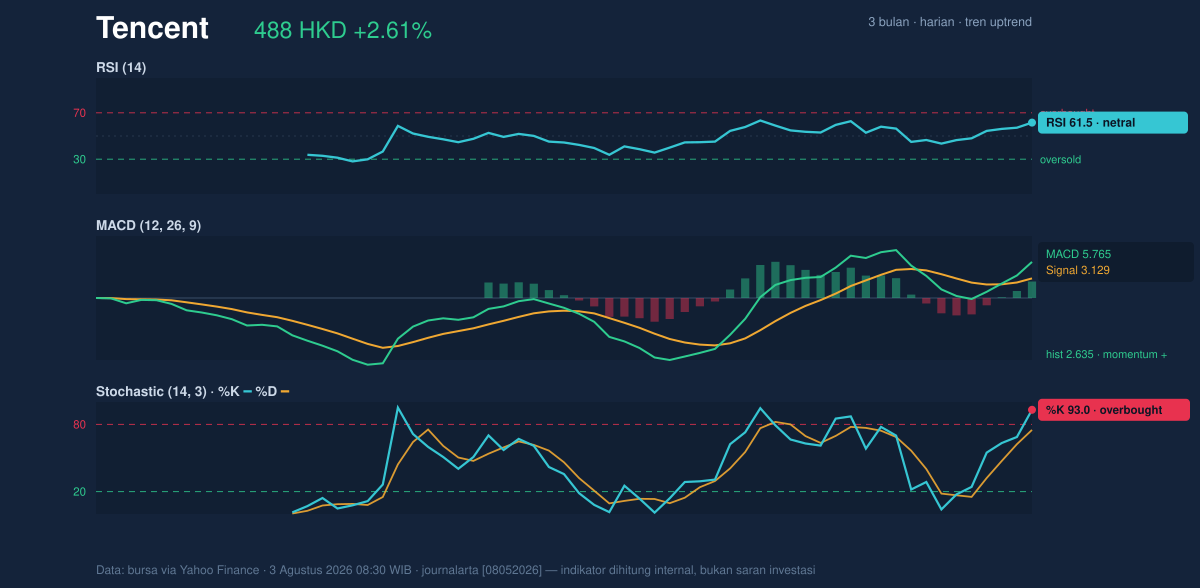
Momentum indicators are mostly supportive, but they also warn that the stock is getting hot. The RSI at 61.5 is still neutral rather than overbought, which means Tencent is not yet flashing a classic exhaustion signal. However, the Stochastic %K at 93.0 and %D at 75.1 are in overbought territory, showing the latest push has been fast enough to leave price near the top of its short-term momentum range. That often happens near resistance, where strong trends can continue for a while but become vulnerable to sharp pauses.
The MACD at 5.765, above the signal line at 3.129 with a positive histogram of 2.635, is the cleaner bullish signal in the set. MACD is essentially measuring whether upward momentum is still outrunning the slower trend baseline, and here it is. That means the stock is not merely drifting higher; buyers still have control of the intermediate trend. The tension is that the stochastic is already stretched while MACD remains positive. That combination often means the trend is alive, but the easy part of the move may already have happened.
Volatility & Volume
Tencent’s ATR(14) of 17.94, equal to 3.7% of price, points to high volatility. For readers, ATR is a rough measure of how much a stock tends to move in a day; a higher reading means wider swings are normal, and stops or break levels matter more. This is especially relevant when the price is near resistance, because a modest pullback can look dramatic in a high-ATR name even when the broader trend remains intact.
Participation looks healthy rather than euphoric. Volume was 38,649,910, above the 20-hour average of 34,599,969, or about 1.1× normal. That is enough to confirm the move without suggesting a panic chase. More importantly, OBV is rising, which indicates that volume has been supporting price advances rather than fading behind them. In technical terms, that is the kind of confirmation traders look for when a stock tests the top of its range.
The message is not “overheated and done.” It is “extended, but still backed by participation.”
Key Levels & Scenarios
The first level to watch is 490.40, the 20-hour resistance, which sits just under the 493.61 Bollinger upper band and just below the 494.80 3-month high. A decisive push through that cluster would signal that Tencent is not only probing the top of its range but attempting to clear it. If that fails, the stock may simply rotate back toward the middle of the band near the SMA20 at 463.47, which is the first technical area where trend followers would look for support.
Below that, 434.60 is the key short-term floor from the 20-hour range, and it also sits above the 433.33 lower Bollinger band. A break of that zone would weaken the current pattern and suggest the recent advance has lost traction. The 411.00 3-month low is the deeper reference point, but the market would likely start re-rating the chart well before that if the nearer support levels gave way.
Technical Verdict: HOLD (wait & see)
HOLD (wait & see)
- MACD remains positive, so the intermediate trend is still supportive.
- Price is above SMA20 and SMA50, confirming the broader uptrend is intact.
- Stochastic is overbought and price is near resistance at 490.40, so the chart is extended rather than fresh.
Verdict invalidated if price falls below 434.60, which would weaken the short-term structure and put the recent rally under pressure.
- Ideal Entry Range: 463.47 to 450.47
- Exit Target (Target Price): 490.40 to 493.61
- Stop Loss protection: 434.60
For non-traders: Tencent’s chart is still strong, but it is now close enough to resistance that the next move matters more than the move already made.
“The stock still has momentum, but it is now testing the ceiling that decides whether this rally breathes or breaks through.”
Summary Data Tencent
| Last price | 487.60 HKD |
| Change 1 day / 5 days / 1 month | 2.61% / 10.07% / 7.88% |
| Trend / MA-cross | uptrend / none |
| SMA20 / SMA50 | 463.47 / 450.47 |
| RSI (14) / Stochastic %K | 61.5 / 93.0 |
| Bollinger %B / ATR | 90% / 17.94 |
| Support / Resistance 20 days | 434.60 / 490.40 |
| Data as of | 3 Agustus 2026 08:30 WIB |
Track Tencent share price daily: live levels, support/resistance and our full Tencent analysis history.



