UOB Stock Technicals Today: Drops 0.35%, Momentum Weakens
On Agustus 5, 2026: price 43.25 SGD, trend sideways, RSI 55.9, support 41.69, resistance 44.95. technical analysis of uob stock. UOB Stock Technicals — full…
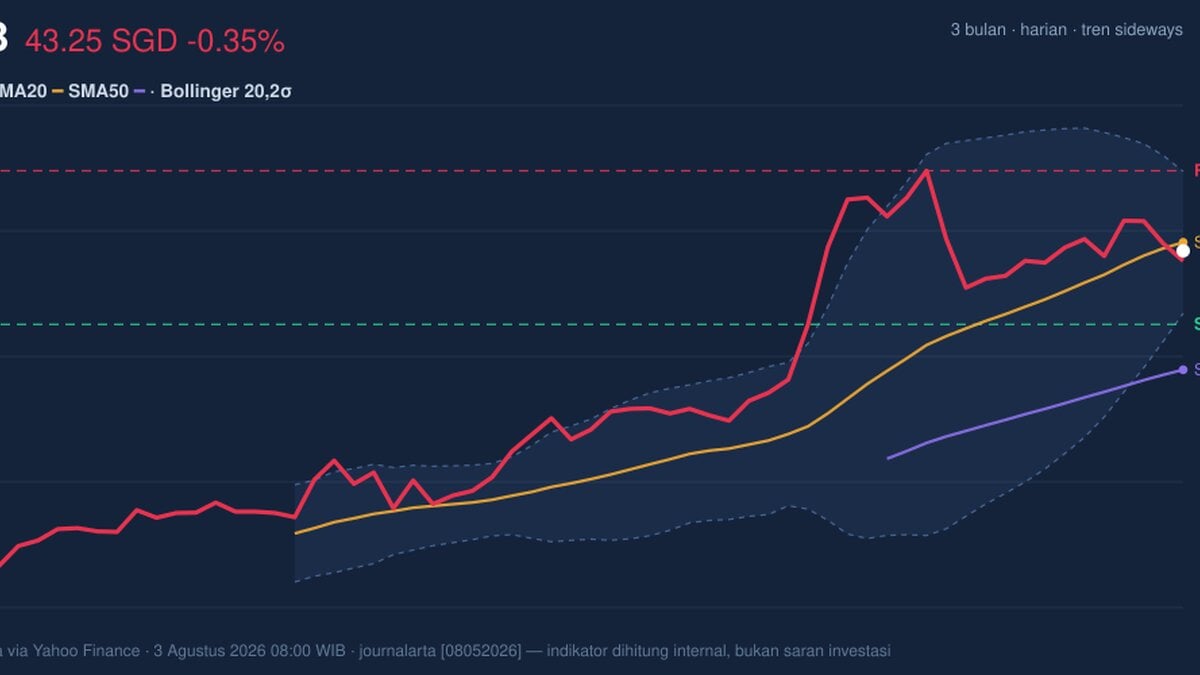
United Overseas Bank’s shares on SGX were last quoted at SGD 43.25, slightly below the previous close of SGD 43.40, as the stock continues to trade in a sideways pattern, according to Yahoo Finance data as of 3 August 2026 08:00 WIB. The immediate message from the tape is not a sharp trend break, but a market that is still digesting gains from the past month while struggling to hold above its short-term average. That matters because UOB is sitting just under its SMA20 at SGD 43.43, which often acts like a short-term balance point; when price slips below it, momentum traders usually read that as a sign the latest advance is losing some authority.
Trend & Price Action
The stock’s 1-month gain of 6.74% shows that the broader move has still been constructive, even if the last 5 days and 1 day have softened. In plain language, that combination suggests UOB has not broken its uptrend structure, but it is no longer pushing higher with the same conviction. The fact that the SMA20 is rising by 2.01% over 5 days is important: a rising short-term average means the underlying trend is still leaning upward, even while the share price is temporarily trading below it. The SMA50 at SGD 40.73 sits well below current levels, which tells readers the medium-term trend remains healthier than the latest pullback.
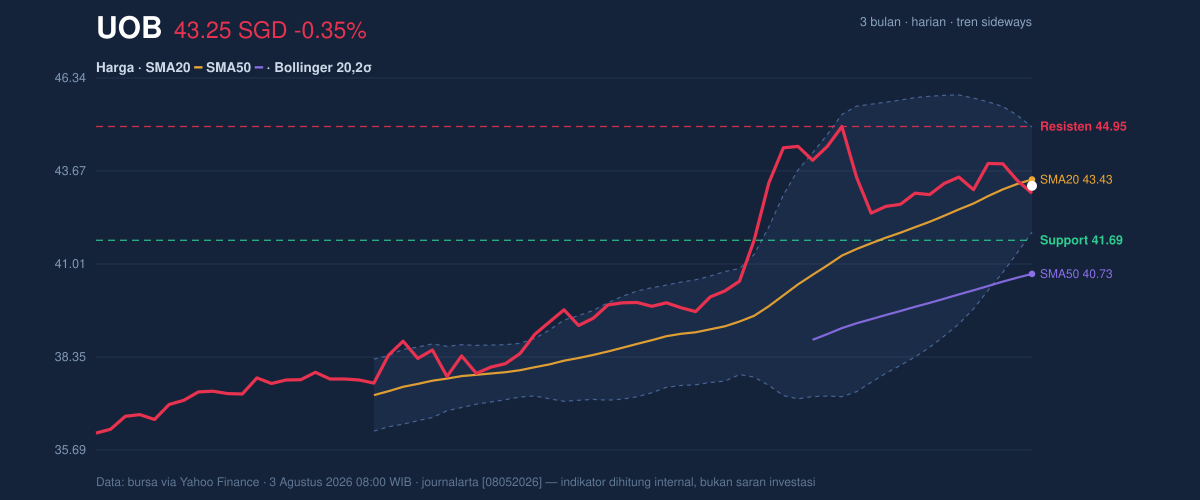
The chart also shows UOB trading at about 48% of its 20-day range, which is a neutral placement rather than an extreme. That position matters because it suggests the market is neither stretched near the top of the recent band nor deeply washed out near support. With 3-month high/low at SGD 45.15 / SGD 36.01, the stock is closer to the upper half of its broader range, but still below the ceiling that has capped the latest advance. In other words, the market has room to recover, yet it has not cleared the area where sellers have recently appeared.
Oscillators & Momentum
Momentum indicators are mixed, and that is the key signal. The RSI at 55.9 is neutral-to-firm, meaning the stock is not overbought and still has some technical breathing room. But the Stochastic %K at 36.3 versus %D at 48.3 shows short-term momentum has cooled and remains below its signal line, which usually points to fading near-term strength rather than a decisive reversal. The clearest warning comes from the MACD at 0.757 below its signal line at 0.931, with a negative histogram of -0.175. That setup means the trend-following momentum gauge has turned negative even though the broader price structure is not damaged.
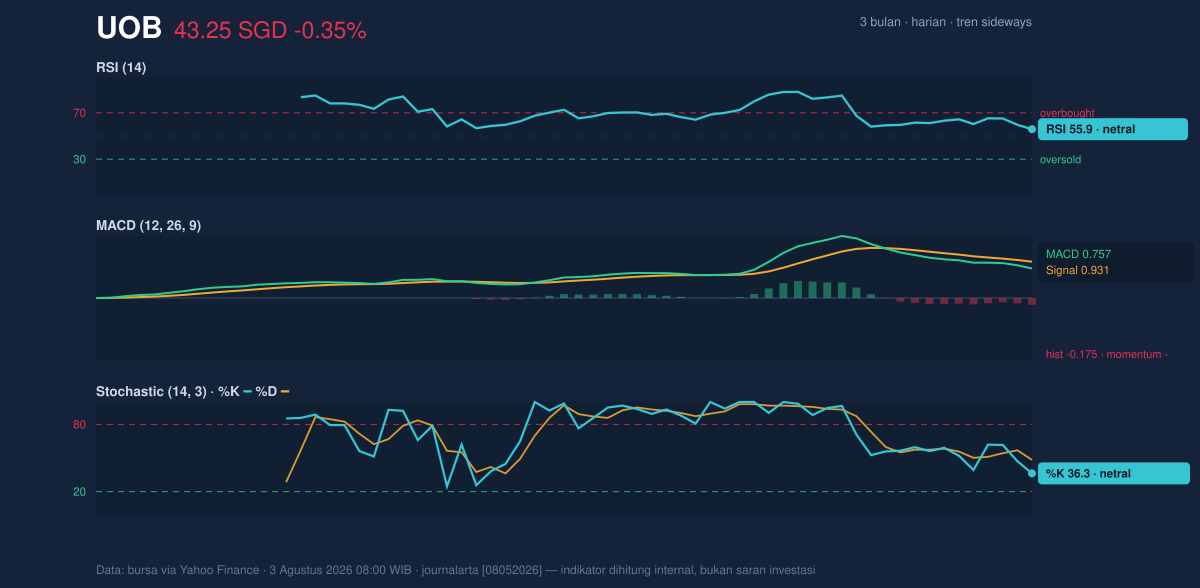
Taken together, these oscillators say UOB is in a pause phase, not a breakdown phase. The RSI is still supportive, but the MACD is telling a more cautious story, and the stochastic line-up suggests the stock may need fresh buying interest before it can retest the upper end of its range. This is the kind of signal set that often appears when a stock is consolidating after a run: the market has not rejected the trend, but it is asking for confirmation.
Volatility & Volume
The Bollinger Bands reinforce that message. UOB’s %B at 44% places the share price below the middle band, which is a sign the stock is trading in the lower half of its recent volatility envelope. More importantly, the Bollinger band width of 6.9% is described as a squeeze, and that matters because tightening bands often precede a sharper move once price escapes the range. A squeeze does not predict direction on its own, but it does say the market is compressing energy rather than dispersing it.
At the same time, ATR(14) at 0.86, or about 2.0% of price, indicates volatility is moderate rather than explosive. That means any break from the current band may initially be measured, not chaotic. Volume adds a cautious note: the latest turnover of 3,987,900 was only 1.1× normal, so the move has not yet been backed by a decisive surge in participation. The OBV is down, which is a subtle but meaningful warning because on-balance volume tracks whether accumulation or distribution is dominating. A falling OBV while price holds up often means buyers are present, but not yet strong enough to overpower sellers consistently.
Key Levels & Scenarios
The immediate technical map is straightforward. Support at SGD 41.69 is the first level that matters on weakness, while resistance at SGD 44.95 is the nearest ceiling to watch on strength. The current price sits between those two markers, but it is leaning closer to support than to resistance in a way that leaves the next move unresolved. If UOB can recover above the SMA20 at SGD 43.43 and then challenge SGD 44.95, the squeeze in Bollinger Bands suggests the stock could begin to unlock a fuller move within the recent range. If it fails to hold SGD 41.69, then the market would be signaling that the short-term consolidation has turned into a deeper retracement.
Technical Verdict: HOLD (wait & see)
The technical picture is mixed enough to justify patience rather than a directional call. MACD remains negative, which argues that short-term momentum is still soft. Price is below the SMA20, showing the latest bounce has not yet regained the short-term trend line. Bollinger Bands are squeezing, which points to a coming move but not yet a confirmed direction.
- Ideal Entry Range: SGD 41.69 to SGD 43.43
- Exit Target: SGD 44.95
- Stop Loss protection: below SGD 41.69
This verdict is invalidated if price breaks below SGD 41.69, because that would weaken the current range and shift the balance toward a deeper correction.
For non-traders, this means UOB is still holding its bigger trend, but the short-term chart has not yet shown enough strength to confirm the next leg higher.
Summary Data UOB
| Last price | 43.25 SGD |
| Change 1 day / 5 days / 1 month | -0.35% / -0.57% / 6.74% |
| Trend / MA-cross | sideways / none |
| SMA20 / SMA50 | 43.43 / 40.73 |
| RSI (14) / Stochastic %K | 55.9 / 36.3 |
| Bollinger %B / ATR | 44% / 0.86 |
| Support / Resistance 20 days | 41.69 / 44.95 |
| Data as of | 3 Agustus 2026 08:00 WIB |
Track UOB share price daily: live levels, support/resistance and our full UOB analysis history.



