BP Stock Analysis: Gains 2.03%, Momentum Weakens
On Agustus 19, 2026: price 533.50 GBp, trend uptrend, RSI 47.9, support 514.90, resistance 555.90. technical analysis of bp stock. BP Stock Analysis — full…

BP plc is holding a fragile recovery on the London market, with the shares above short-term trend support but still short of convincing momentum. The message from the chart is mixed: price is firming, yet participation and momentum have not fully confirmed the move.
BP closed at 533.50 GBp, up from 522.90 the previous close, a 2.03% one-day gain that extends the 1.70% rise over five days and 2.22% over one month. That keeps the stock in an uptrend, but one that is still being tested. The shares are trading above SMA20 at 532.84 and well above SMA50 at 511.36, which matters because it shows the price is holding above both the near-term and medium-term average. In plain terms, the market is still giving BP the benefit of the doubt. The slope of the SMA20 at 0.55% over five days suggests the short-term trend is pointing higher, but there has been no fresh MA-cross to signal a stronger trend shift, as shown in the chart.
Trend & Price Action
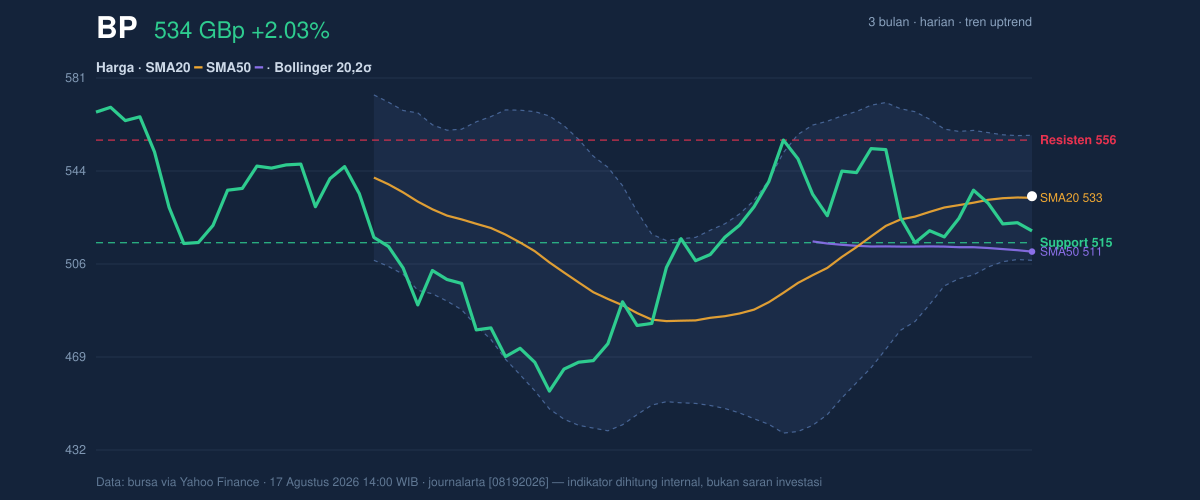
The current position inside the recent range is also important. BP is trading at 45% of the 20-hour range, with support at 514.90 and resistance at 555.90. That puts the shares closer to the lower half of the band than to the top, even after the bounce. The stock is also below the 3-month high of 575.70 and above the 3-month low of 450.60, so it is recovering, but not yet pressing into breakout territory.
The Bollinger Band structure adds another layer. With the middle band at 532.84, price is sitting almost exactly on the band’s centreline, while %B at 51% says the stock is neither stretched nor cheap relative to the recent volatility envelope. The upper band at 557.82 is close to the stated resistance at 555.90, which means the next upside test is likely to meet overhead supply quickly. The 9.4% band width is normal, not compressed, so the market is not in a volatility squeeze that would typically precede a sharp breakout. Instead, the chart suggests a steady, range-aware advance rather than an explosive move.
Oscillators & Momentum
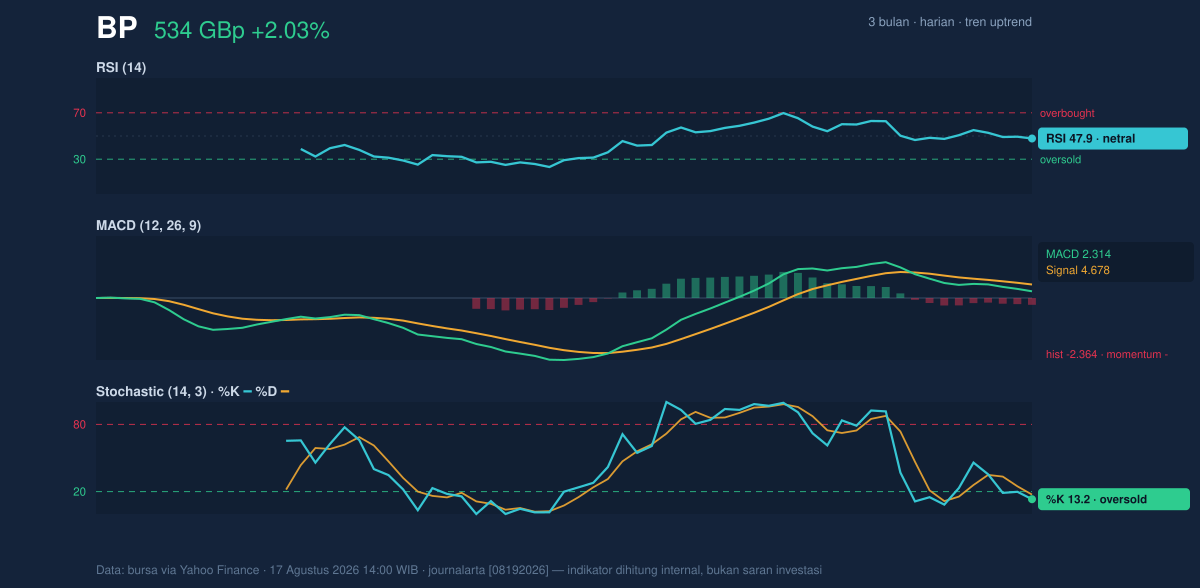
Momentum is where the picture becomes more cautious. The RSI at 47.9 is neutral, which means BP is not overbought and not oversold on this measure. That is consistent with a market that is stabilising rather than accelerating. The stronger short-term clue comes from the stochastic oscillator: %K at 13.2 and %D at 17.3 are both in oversold territory. That often signals that selling pressure has already done much of its work, or that a rebound can continue if buyers step in. But oversold alone is not a buy signal; it needs support from other indicators.
That support is missing for now. The MACD at 2.314 sits below its signal line at 4.678, leaving a -2.364 histogram. In practical terms, that means the short-term trend is still lagging the longer-term trend, and upward price movement has not yet translated into bullish momentum confirmation. This is why the stock can rise while still looking technically restrained: price is improving, but momentum is not fully agreeing. The combination of a neutral RSI, oversold stochastic, and negative MACD often points to an early-stage recovery that is vulnerable to pauses.
Volatility & Volume
Volatility is moderate rather than extreme. The ATR(14) at 15.08, equal to 2.8% of price, suggests BP can still move enough in a session to test nearby levels, but not in a disorderly way. That matters because the distance to resistance is not large relative to daily movement capacity. A push toward 555.90 is feasible, but so is a retreat back toward support if buyers fade.
Volume, however, does not yet validate the move. Last session volume was 34,926,951, below the 20-hour average of 50,994,057, or about 0.7x normal. In market terms, that means the rally is happening on lighter participation than usual. The OBV is falling, which is a warning sign because on-balance volume tracks whether money flow is broadly supporting price. When price rises but OBV slips, it often means the move is not being backed by broad accumulation. As shown in the chart, the rally has not yet earned strong volume confirmation.
Key Levels & Scenarios
The immediate technical map is clear. A sustained move above 555.90 resistance would open the way toward the upper Bollinger band at 557.82, and then the market would begin to challenge the upper part of the recent range. If BP fails to hold the 532.84 SMA20, the stock could drift back toward 514.90 support, where the market last found a more meaningful floor. A break below 514.90 would weaken the current recovery structure and bring the 511.36 SMA50 into focus as the next technical reference.
Technical Verdict: HOLD (wait & see)
The setup is constructive, but not strong enough to call fully confirmed momentum. The reasons are:
- Price is above SMA20 and SMA50, which keeps the broader structure positive.
- MACD remains below the signal line, showing momentum has not yet turned fully supportive.
- Volume is only 0.7x normal and OBV is falling, so the move lacks participation confirmation.
The verdict is invalidated if price breaks below 514.90, because that would compromise the nearest support and weaken the current uptrend structure.
- Ideal Entry Range: 532.84 to 514.90, where price is near the SMA20 and support zone.
- Exit Target: 555.90 to 557.82, the resistance area and upper Bollinger band.
- Stop Loss protection: below 514.90, with added caution if the price loses 511.36.
In plain English: BP is trying to recover, but the chart still wants proof. The next notable test is whether the shares can push through 555.90 without losing 514.90 first.
Summary Data BP
| Last price | 533.50 GBp |
| Change 1 day / 5 days / 1 month | 2.03% / 1.70% / 2.22% |
| Trend / MA-cross | uptrend / none |
| SMA20 / SMA50 | 532.84 / 511.36 |
| RSI (14) / Stochastic %K | 47.9 / 13.2 |
| Bollinger %B / ATR | 51% / 15.08 |
| Support / Resistance 20 days | 514.90 / 555.90 |
| Data as of | 17 Agustus 2026 14:00 WIB |
Track BP share price daily: live levels, support/resistance and our full BP analysis history.