AIA Stock Drops 0.54% Today, Momentum Weakens
On Agustus 20, 2026: price 73.00 HKD, trend sideways, RSI 41.6, support 70.40, resistance 79.65. technical analysis of aia stock. AIA Stock Drops — full…

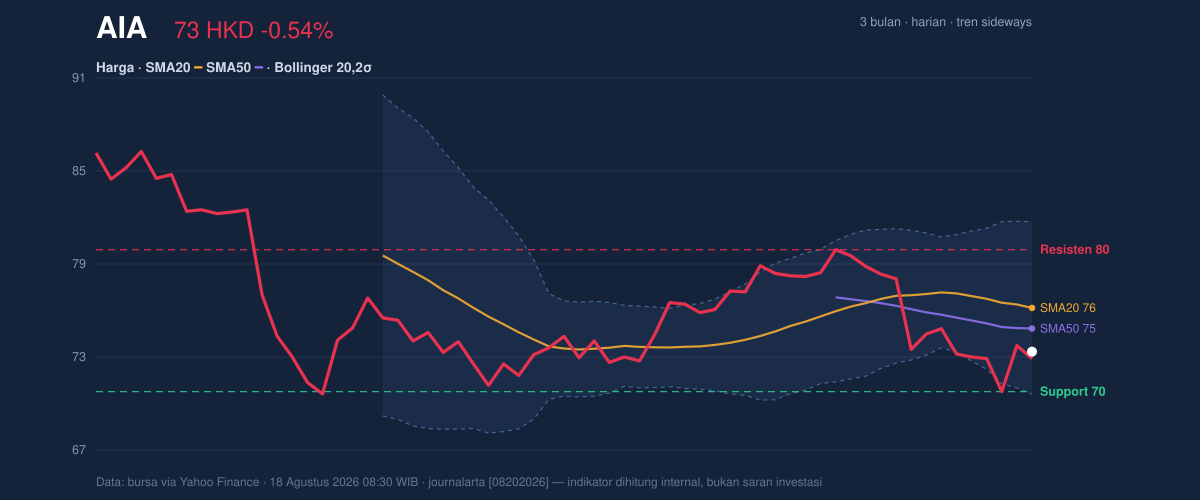
AIA Group ended at HKD 73.00, down 0.54% from the previous close of 73.40, and the tape still looks trapped in a sideways range rather than a clean trend. The stock is trading below SMA20 at 75.85 and also below SMA50 at 74.51, which tells traders the recent bounce has not yet reclaimed the short- to medium-term averages that often act as a test of momentum. As shown in the chart, the price is sitting in the lower portion of its recent band, with the market now watching whether the current consolidation is a pause before recovery or a drift toward the lower edge of support.
Trend & Price Action
The broader signal is still cautious. The trend is marked sideways, but the SMA20 slope of -1.24% over 5 days shows that even the near-term average is leaning lower, not flattening out convincingly. That matters because a sideways label can hide weakness when the moving average itself is tilting down. In practical terms, the stock is not losing ground in a straight line, but it is also not building the kind of base that usually precedes sustained upside.
The absence of a fresh MA-cross is also telling. A new bullish crossover would normally suggest short-term price strength overtaking the medium-term trend; a bearish crossover would warn of deeper deterioration. Here, the lack of a new cross means the market is still waiting for confirmation, and that uncertainty is reflected in the stock sitting below both moving averages. The 1-month performance of -5.13% reinforces that the recent drift has been negative even if the 5-day change is nearly flat.
Oscillators & Momentum
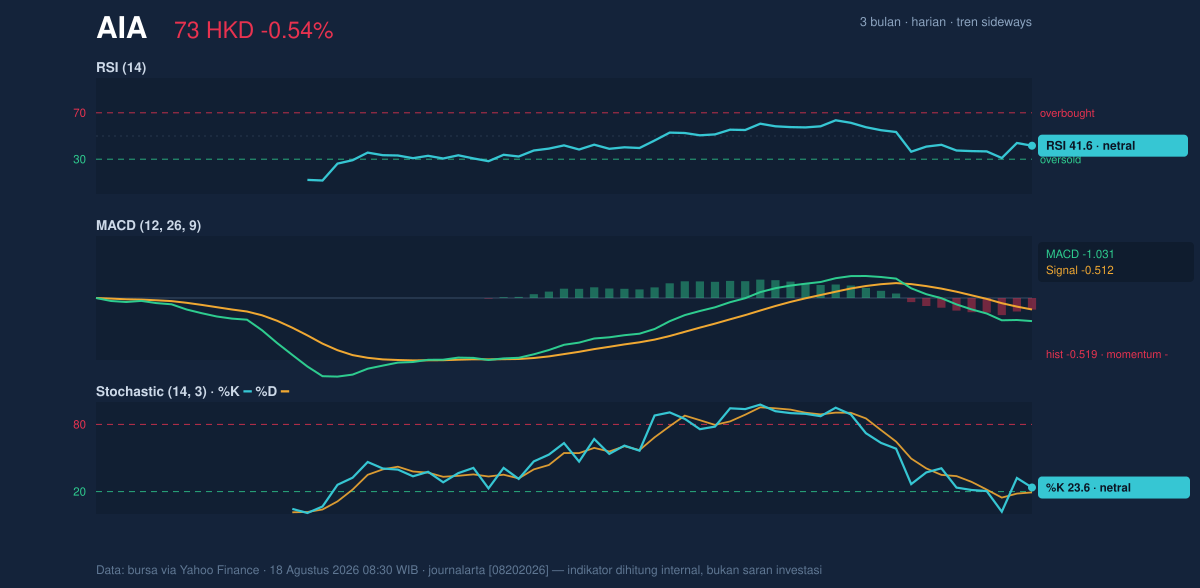
The momentum picture is mixed, but tilted lower. The RSI(14) at 41.6 is still in neutral territory, which means the stock is not yet oversold and does not show the kind of stretched selling that often sparks a fast rebound. The Stochastic %K at 23.6 and %D at 19.3 are also neutral, though they are hovering near the lower end of the scale. That positioning suggests the stock is weak, but not exhausted.
The more important signal is the MACD at -1.031, below its signal line at -0.512, with a histogram of -0.519. In plain language, the trend-following momentum gauge is still negative, and the gap between MACD and signal line shows bearish pressure remains in place. This is why the chart matters: the oscillators are not flashing panic, but they are also not confirming a durable turn higher. For technicians, that combination often means the market needs more price repair before momentum can improve.
Volatility & Volume
Volatility is present, but not extreme. The Bollinger Bands are set at 81.48 on the upper side, 75.85 in the middle, and 70.23 on the lower side, with %B at 25%. That places the share price closer to the lower band than the middle, a sign that the market is trading in the weaker part of its recent range. The band width of 14.8% is described as normal, so this is not a compression setup waiting for a violent breakout; it is more a steady, moderately volatile drift within established boundaries.
The ATR(14) at 2.24, or 3.1% of price, confirms movement is moderate rather than subdued. That matters because a stock with this level of daily range can still move meaningfully without needing a major news catalyst. Volume, however, is not providing strong confirmation. Last volume was 26,581,511, below the 20-session average of 29,068,786, or 0.9× normal. When price weakens on lighter-than-average participation, the move can be less convincing. But the OBV is falling, which means cumulative volume flow is still leaning out of the stock. That is a subtle but important warning: even without heavy turnover, the balance of participation has not turned supportive.
Key Levels & Scenarios
The nearest reference points are clear. Support at 70.40 is the first level that matters, while resistance at 79.65 is the ceiling the market needs to reclaim before the chart can look healthier. The stock is currently trading at 28% of its 20-hour range, which places it closer to support than resistance and leaves less room for optimism unless buyers step in soon. The 3-month low at 69.05 sits just below current support, so a failure to hold 70.40 would expose the market to a retest of that lower boundary.
If price stabilizes above 70.40 and begins to recover toward the 75.85 middle Bollinger band and the SMA20, that would signal the stock is trying to rebuild short-term balance. If it fails to hold 70.40, the technical tone weakens quickly because the chart would be slipping toward the 69.05 3-month low. On the upside, a move through 79.65 would be more than a routine bounce; it would suggest the market has absorbed recent selling and is challenging the upper half of the range.
Technical Verdict: HOLD (wait & see)
HOLD (wait & see) fits the chart because the stock is below SMA20 and SMA50, MACD remains negative, and OBV is falling, while RSI and Stochastic are neutral rather than oversold. The setup is not broken, but it has not yet shown enough strength to confirm a turn. The verdict is invalidated if price breaks below 70.40, because that would put the 3-month low at 69.05 back in play and deepen the downside bias.
- Ideal Entry Range: 70.40 to 75.85, where support and the SMA20 offer the clearest technical test
- Exit Target (Target Price): 79.65, the nearest resistance and upper boundary of the current range
- Stop Loss protection: below 70.40, with 69.05 as the deeper downside reference
In plain English, the chart says AIA is still waiting for proof that sellers are losing control.
Summary Data AIA
| Last price | 73.00 HKD |
| Change 1 day / 5 days / 1 month | -0.54% / 0.21% / -5.13% |
| Trend / MA-cross | sideways / none |
| SMA20 / SMA50 | 75.85 / 74.51 |
| RSI (14) / Stochastic %K | 41.6 / 23.6 |
| Bollinger %B / ATR | 25% / 2.24 |
| Support / Resistance 20 days | 70.40 / 79.65 |
| Data as of | 18 Agustus 2026 08:30 WIB |
Track AIA share price daily: live levels, support/resistance and our full AIA analysis history.