AMZN Momentum Weakens: Stock Gains 2.46% (Agustus 20, 2026)
On Agustus 20, 2026: price 265.84 USD, trend uptrend, RSI 55.5, support 226.65, resistance 284.02. technical analysis of amzn stock. AMZN Momentum Weakens —…

Amazon shares on Nasdaq rose to 265.84 dollars, up 2.46% from the previous close of 259.45, according to Yahoo Finance data at 19 August 2026 20:30 WIB. The move keeps the stock in an uptrend, but the tape is sending a mixed message: price is above its short-term average, while momentum gauges are not fully confirming the advance.
Trend & Price Action
The first signal is constructive. Amazon is trading above its SMA20 at 258.73 and comfortably above its SMA50 at 249.00, which tells traders the medium-term structure still leans upward. The SMA20 slope of 1.47% over 5 days reinforces that the near-term trend is still rising rather than flattening out.
But the chart also shows the stock is not breaking away cleanly. The price sits at about 68% of the 20-hour range between support at 226.65 and resistance at 284.02, as shown in the chart. That positioning matters: it suggests Amazon has recovered well from the lower part of the range, yet it is still below the upper boundary where sellers have previously appeared. The stock is also still short of the 3-month high at 287.20, which means the recent rebound has room to continue, but only if it can absorb supply near the upper end of the band.
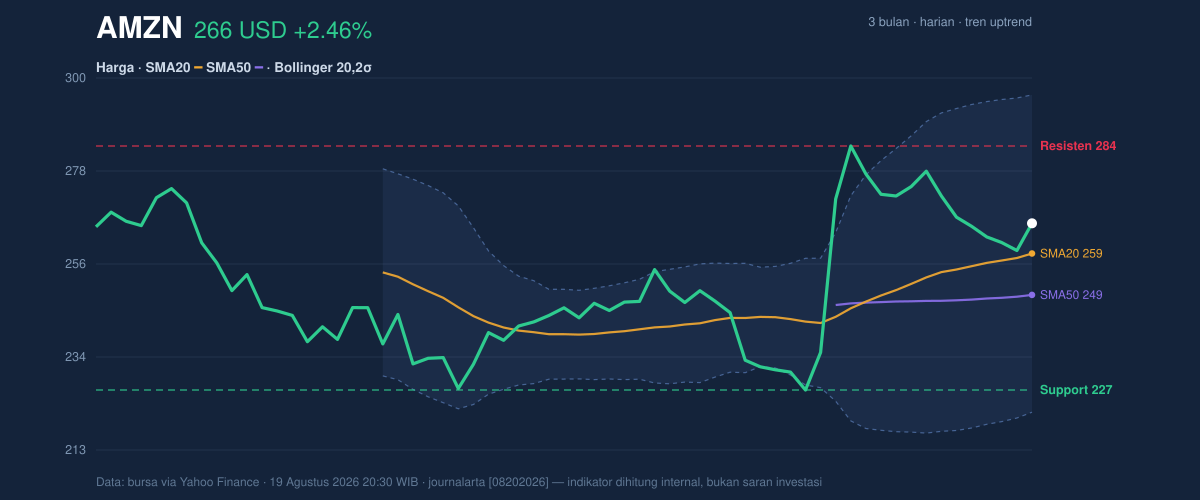
The Bollinger midline at 258.73 is now acting as a technical pivot. With price above that line, the short-term bias remains positive. However, the upper band at 296.02 and lower band at 221.44 show a wide operating range, and the 28.8% band width says volatility is elevated. In plain terms, the stock is not coiling quietly; it is moving in a wider-than-usual envelope, which often means sharper swings in both directions.
Oscillators & Momentum
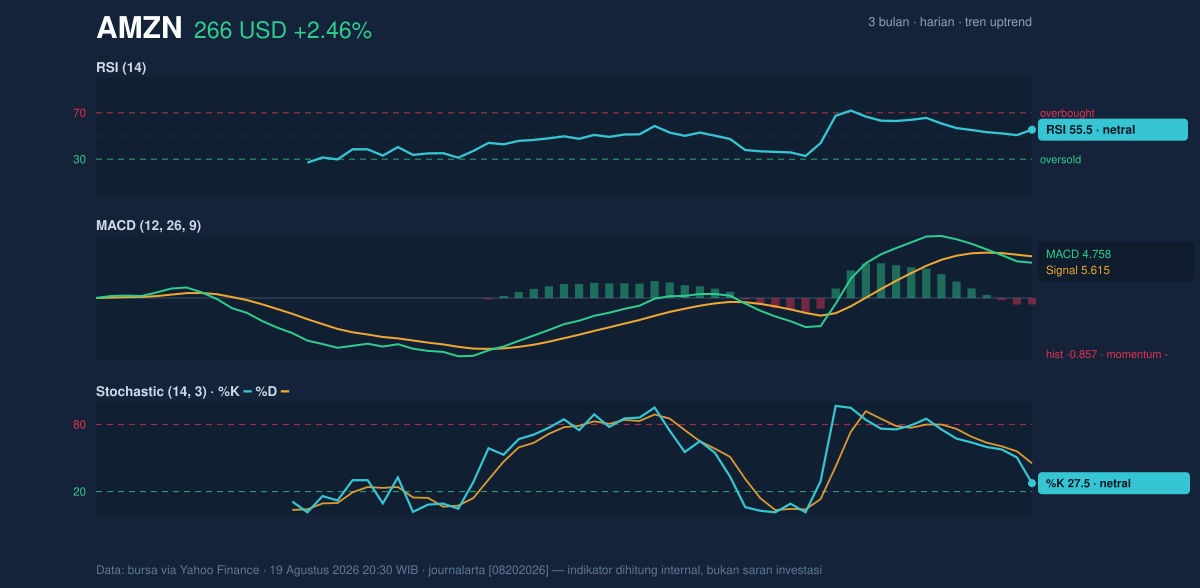
The momentum picture is less convincing than the trend picture. RSI at 55.5 is neutral, which means Amazon is neither overheated nor oversold. That is usually a healthy reading in an uptrend because it leaves room for further gains. But it is not a strong momentum endorsement on its own.
The more important signal is the MACD at 4.758 versus the signal line at 5.615, with a histogram of -0.857. That negative histogram means the faster trend measure is running below the slower one, a sign that upward momentum has weakened even though price remains above key averages. This is the kind of divergence traders watch closely: price can still look firm while the internal push behind it fades.
The Stochastic %K at 27.5 and %D at 45.2 are also neutral, but the gap suggests the stock is still working through a softer short-term momentum phase rather than launching decisively upward. As shown in the chart, the oscillators are not flashing a reversal from an extreme; instead, they point to a stock that has recovered, but not yet re-accelerated.
Volatility & Volume
Volatility is doing some of the talking here. The ATR(14) at 9.46, equal to 3.6% of price, indicates a day-to-day move large enough to matter. Combined with the widening Bollinger bands, that suggests Amazon could travel quickly once it leaves the current mid-range. Volatility expansion often precedes a more decisive directional move, but it does not tell you which way by itself.
Volume is the caution flag. Last volume was 35,613,300, below the 20-day average of 48,888,000, or about 0.7x normal. That means the latest rise was not backed by full participation. When a stock climbs on lighter turnover, the move can still be valid, but it is usually less persuasive than a rally supported by heavy trading. The OBV is down, which reinforces that the broader accumulation trend is not yet confirming the recent price strength. In practical terms, price has improved faster than participation.
Key Levels & Scenarios
The nearest technical map is clear. Support at 226.65 is the major floor in the 20-hour structure, while resistance at 284.02 is the first ceiling to watch. Above that, the 3-month high at 287.20 becomes the next reference point, and beyond that the Bollinger upper band at 296.02 marks the outer edge of the current volatility envelope.
If Amazon holds above the SMA20 at 258.73 and pushes through 284.02, the chart would show a stronger continuation pattern, especially if volume improves and the MACD histogram turns back toward zero. If it fails to hold the 258.73 area, the market would be signaling that the recent bounce is losing traction, and the next test would likely shift attention toward the lower part of the range and the 221.44 Bollinger floor.
Technical Verdict: HOLD (wait & see)
HOLD (wait & see)
- Price is above SMA20 and SMA50, which supports the broader uptrend.
- MACD histogram is negative, showing momentum is weaker than price action.
- Volume is only 0.7x normal and OBV is down, so the rebound lacks strong participation.
Verdict invalidated if price falls below 226.65, the current support level that anchors the range.
- Ideal Entry Range: 258.73 to 265.84
- Exit Target: 284.02 to 287.20
- Stop Loss protection: below 226.65
In plain English: Amazon looks technically healthy, but the current rally still needs stronger momentum and volume before the move looks fully convincing.
The next important test is whether the stock can reclaim 284.02 and then challenge the 287.20 three-month high.
Summary Data AMZN
| Last price | 265.84 USD |
| Change 1 day / 5 days / 1 month | 2.46% / -0.54% / 8.57% |
| Trend / MA-cross | uptrend / none |
| SMA20 / SMA50 | 258.73 / 249.00 |
| RSI (14) / Stochastic %K | 55.5 / 27.5 |
| Bollinger %B / ATR | 60% / 9.46 |
| Support / Resistance 20 days | 226.65 / 284.02 |
| Data as of | 19 Agustus 2026 20:30 WIB |
Track AMZN stock price daily: live levels, support/resistance and our full AMZN analysis history.