AstraZeneca Stock Technicals Today: Gains 4.24%, Momentum Weakens
On Agustus 20, 2026: price 12,050.00 GBp, trend downtrend, RSI 40.8, support 11,460.00, resistance 13,134.00. technical analysis of astrazeneca stock.

According to LSE-linked market data cited via Yahoo Finance at 18 August 2026 14:00 WIB, AstraZeneca’s shares last traded at 12,050.00 GBp, up 4.24% on the day, but still sitting below the 20-day average and well under the longer 50-day average. That combination matters: the stock can bounce sharply inside a broader downtrend, but until it reclaims the short-term trend line, the move reads more as a relief rally than a confirmed reversal.
Trend & Price Action
The chart shows a stock that is still trying to repair damage rather than decisively change direction. Price is below SMA20 at 12,173.30 and far below SMA50 at 12,945.12, which keeps the medium-term structure tilted lower. The SMA20 slope is -1.78% over 5 days, a clear sign that recent trading has been sliding rather than stabilising. In plain terms, the short-term trend is still pointing down, even though the day’s gain has interrupted the pressure.
The broader range also frames the move. AstraZeneca is trading between the 3-month low of 9,892.00 and the 3-month high of 15,126.00, and at 35% of the 20-hour range it is not near the top of that band. That placement suggests the market has not yet priced in a full recovery. The nearest visible floor is the 20-hour support at 11,460.00, while the first meaningful ceiling sits at 20-hour resistance at 13,134.00.
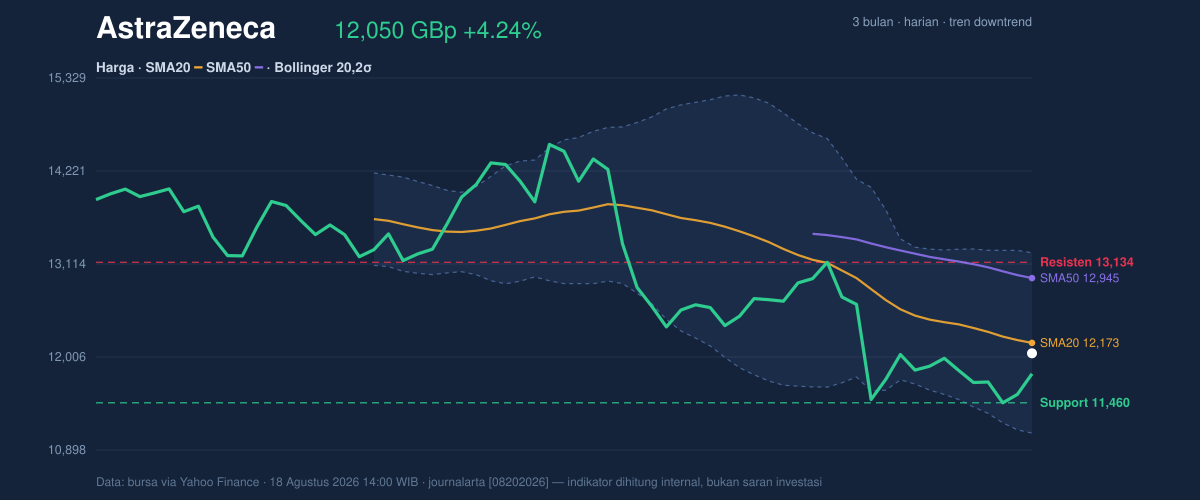
Just as important, there is no fresh MA cross to signal a trend regime change. A moving-average crossover is one of the cleaner signs that momentum has shifted from one side to the other; without it, the current rebound remains technically unconfirmed. The stock is also trading below the Bollinger midline at 12,173.30, which means it has not yet reclaimed the band’s centre of gravity.
Oscillators & Momentum
The momentum picture is mixed, but not yet constructive enough to call a clean turnaround. RSI(14) at 40.8 sits in neutral territory, which tells us the shares are not oversold enough to imply a forced rebound, nor overbought enough to suggest the rally is stretched. That is a useful signal because it leaves room for either direction, but it also says the market has not built strong bullish conviction.
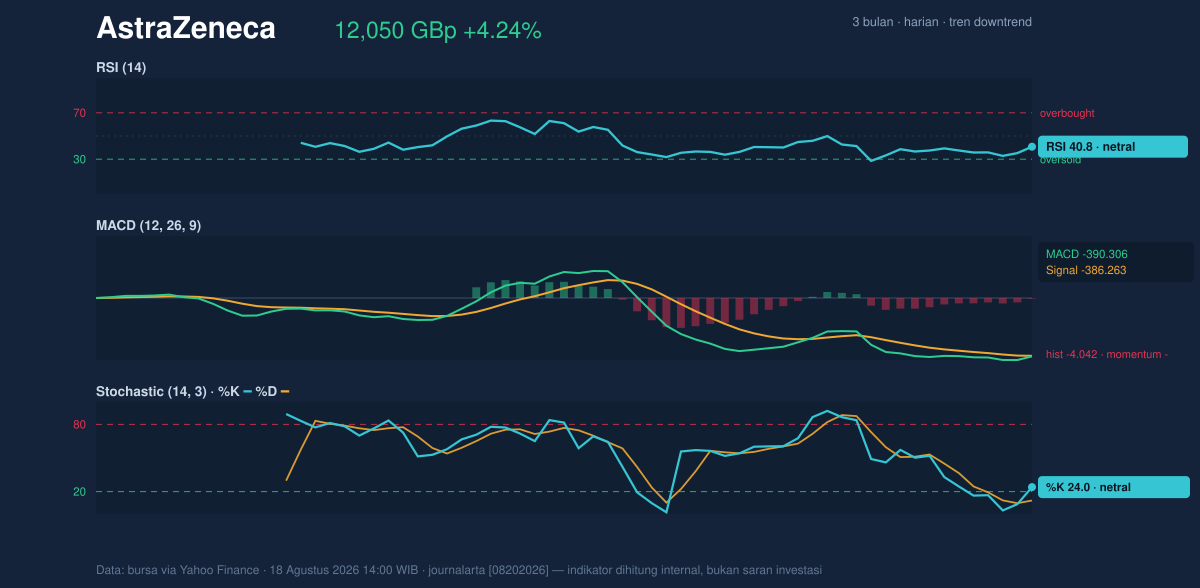
The stochastic reading is more interesting. Stochastic %K at 24.0 and %D at 12.0 suggests the stock has been weak enough to sit near the lower end of its recent trading band, but the lines remain in a neutral zone rather than flashing a decisive reversal. Meanwhile, MACD at -390.306 is still below the signal line at -386.263, with a negative histogram of -4.042. That matters because MACD is a trend-following indicator: when it stays below its signal line, downside momentum is still technically in control, even if the price has bounced for a session.
Volatility & Volume
Volatility is present, but not extreme. ATR(14) at 374.08, or 3.1% of price, points to a market that can move meaningfully without being disorderly. The Bollinger Bands reinforce that reading: the band width of 17.6% is normal, not compressed into a squeeze and not blown out into panic. In practical terms, the stock is not setting up for a dramatic volatility break simply because the bands are tight; it is trading in an ordinary volatility regime.
%B at 44% means the shares are below the midpoint of the Bollinger envelope, which is consistent with a market that has recovered some ground but has not yet pushed into the upper half of the range. Volume adds a note of caution. Last volume of 3,194,491 was only 0.7x normal versus the 20-day average, so the day’s rise was not backed by especially heavy participation. That can happen on a rebound, but it also means the move has not yet been strongly validated by the wider market. The one encouraging divergence is that OBV is rising, which suggests buying interest has been accumulating even as the headline volume remains subdued.
Key Levels & Scenarios
The nearest technical map is straightforward. 11,460.00 is the first support to watch, and it lines up with the lower part of the recent range. If that level holds, the stock can continue trying to rebuild toward 12,173.30, where the Bollinger midline and SMA20 sit together. That zone is important because reclaiming it would indicate the rebound is no longer just a reflex move. Above that, 13,134.00 is the first resistance that would need to give way before the chart starts looking healthier.
If the shares fail to hold 11,460.00, the chart would reopen the path toward the lower end of the 3-month range at 9,892.00. If, instead, the stock pushes through 12,173.30 and then challenges 13,134.00, the signal would shift from a weak bounce to a more credible trend repair. For now, the price is still below the key short-term averages, so the burden of proof remains on the bulls.
Technical Verdict: HOLD (wait & see)
HOLD (wait & see) fits the current setup because the stock has rebounded, but the trend has not yet turned.
- MACD remains negative, showing downside momentum is still active.
- Price is below SMA20 and SMA50, so the broader trend still leans lower.
- OBV is rising, which hints at accumulation, but the move lacks strong volume confirmation.
- Verdict invalidated if price breaks below 11,460.00, because that would weaken the nearest support and expose the lower range.
- Ideal Entry Range: 11,460.00 to 12,173.30
- Exit Target: 13,134.00
- Stop Loss protection: below 11,460.00
In plain English: the share price has bounced, but it has not yet proven that the downtrend is over.
Newest hard fact: AstraZeneca’s last price was 12,050.00 GBp, with 20-hour support at 11,460.00 and resistance at 13,134.00.
Summary Data AstraZeneca
| Last price | 12,050.00 GBp |
| Change 1 day / 5 days / 1 month | 4.24% / 1.74% / -3.54% |
| Trend / MA-cross | downtrend / none |
| SMA20 / SMA50 | 12,173.30 / 12,945.12 |
| RSI (14) / Stochastic %K | 40.8 / 24.0 |
| Bollinger %B / ATR | 44% / 374.08 |
| Support / Resistance 20 days | 11,460.00 / 13,134.00 |
| Data as of | 18 Agustus 2026 14:00 WIB |
Track AstraZeneca share price daily: live levels, support/resistance and our full AstraZeneca analysis history.