BP Stock Gains 3.79%, Momentum Weakens In Focus
On Agustus 20, 2026: price 539.30 GBp, trend uptrend, RSI 54.1, support 514.90, resistance 555.90. technical analysis of bp stock. BP Stock Gains — full…

BP plc is holding above a short-term trend line, but the tape is not giving a clean bullish signal yet: the shares closed at 539.30 GBp, up 3.79% on the day, with the move taking the stock further above its 20-day average while momentum remains mixed.
Trend & Price Action
As shown in the chart, BP’s share price is trading above SMA20 at 533.05 and well clear of SMA50 at 511.45, which keeps the broader structure in an uptrend. That matters because price above both moving averages usually signals that recent buying has been strong enough to keep the trend intact. The 20-day average is also still rising, with a slope of 0.40% over 5 days, so the short-term trend is not only positive but still building.
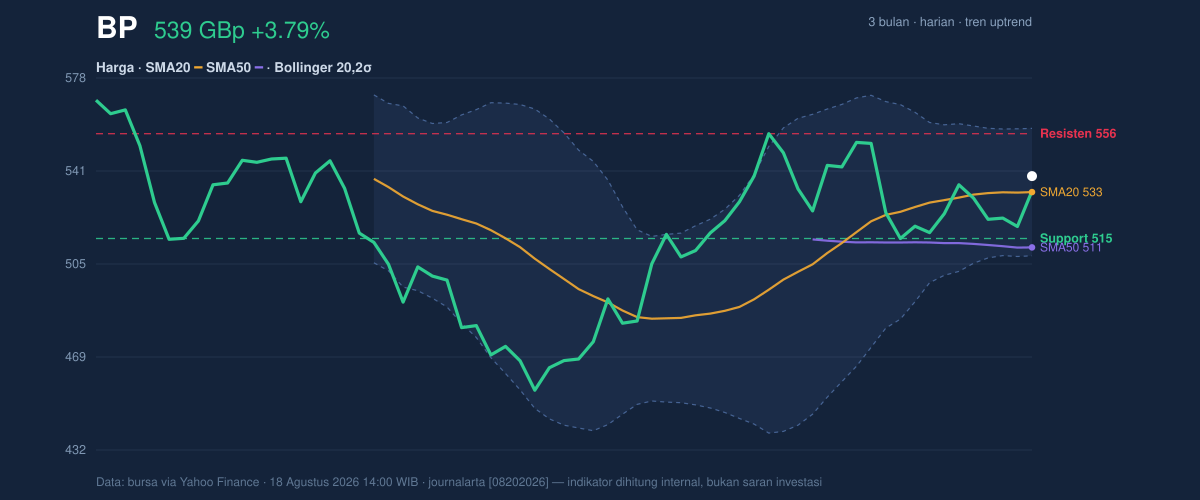
The catch is that the stock is not yet breaking away decisively. At 539.30 GBp, BP sits around the middle of its recent range and below the 20-day Bollinger upper band at 557.97. In plain English, the market is leaning constructive, but it has not pushed into a strong momentum breakout. The share price is also still below the 3-month high of 575.70, which suggests there is overhead supply from investors who bought closer to that level and may be waiting to exit on strength.
Oscillators & Momentum
The oscillators tell a more cautious story. RSI at 54.1 is neutral, which means the stock is neither stretched nor oversold. That is usually a sign of balance, not conviction. Stochastic %K at 41.1 and %D at 24.7 also sit in neutral territory, but the gap between the two lines suggests some near-term recovery from weaker levels rather than a fully established acceleration.
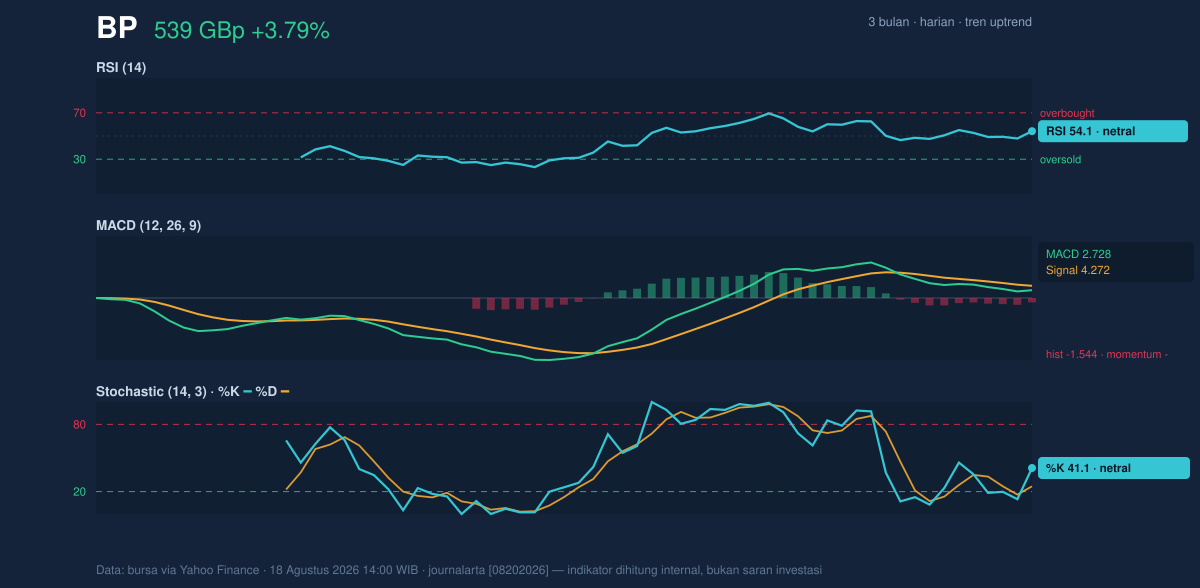
The more important signal is MACD at 2.728 versus signal at 4.272, with a histogram of -1.544. That negative histogram means short-term momentum is still lagging the broader trend. In practical terms, price can remain firm while momentum cools; that often happens during pauses or consolidation phases. So even though the trend is up, the momentum tools are warning that the move is not yet fully confirmed.
Volatility & Volume
Volatility is moderate rather than explosive. ATR at 14.86, equal to 2.8% of price, means BP can move enough in a session to matter, but not in a disorderly way. The Bollinger Band width of 9.4% is described as normal, which points to a market that is active but not in a squeeze or panic expansion. A squeeze would hint at an imminent sharp move; a normal width suggests the stock is still digesting recent gains.
Volume adds a useful nuance. Last volume was 62,327,202, about 1.2× the 20-day average of 52,652,112. That is decent participation and supports the day’s advance. But OBV is down, and that matters: on-balance volume tracks whether trading pressure is accumulating or leaking away over time. A falling OBV while price is rising can mean the rally is not being backed by broad, sustained accumulation yet. In other words, the market is trading the stock, but not all of that trading is clearly supportive.
Key Levels & Scenarios
The nearest support is 514.90, while the nearest resistance is 555.90. BP is currently sitting at about 60% of the range between those levels, which places it closer to resistance than support without being at a breakout point. That positioning often leaves the stock vulnerable to either a retest of support or a push toward the upper band, depending on whether momentum improves.
The Bollinger framework sharpens that view. The middle band at 533.05 now acts as a short-term pivot, and the upper band at 557.97 aligns closely with the resistance zone. If BP can push through that area, it would signal that the recent advance is being accepted by the market rather than simply fading into a range. If it fails there, the stock could drift back toward the middle band and then the 514.90 support area.
The broader range still matters too: the 3-month low of 450.60 marks the deeper floor for the trend, but the market is far enough above that level that the immediate debate is now about whether the stock can extend beyond the upper half of its recent band.
Technical Verdict: HOLD (wait & see)
HOLD (wait & see)
- Price is above SMA20 and SMA50, which supports the trend.
- MACD histogram is negative, showing momentum is not fully confirming the price rise.
- OBV is down, so participation is not yet clearly validating the move.
Verdict invalidated if price falls below 514.90, because that would break the nearest support and weaken the short-term structure.
- Ideal Entry Range: 533.05 to 514.90
- Exit Target: 555.90 to 557.97
- Stop Loss protection: below 508.13
For non-traders: BP looks technically stable, but the charts still need stronger momentum before the current rise can be treated as more than a pause inside an uptrend.
The next visible test is whether the shares can clear 555.90 and hold above the 557.97 Bollinger ceiling.
Summary Data BP
| Last price | 539.30 GBp |
| Change 1 day / 5 days / 1 month | 3.79% / 0.63% / 1.89% |
| Trend / MA-cross | uptrend / none |
| SMA20 / SMA50 | 533.05 / 511.45 |
| RSI (14) / Stochastic %K | 54.1 / 41.1 |
| Bollinger %B / ATR | 63% / 14.86 |
| Support / Resistance 20 days | 514.90 / 555.90 |
| Data as of | 18 Agustus 2026 14:00 WIB |
Track BP share price daily: live levels, support/resistance and our full BP analysis history.