CRM Stock Technicals Today: Gains 5.07%, Testing Key Resistance
On Agustus 20, 2026: price 206.09 USD, trend uptrend, RSI 64.8, support 156.93, resistance 206.09. technical analysis of crm stock. CRM Stock Technicals — full…

Salesforce Inc. (NYSE: CRM) rose to 206.09 USD in New York, up 5.07% on the day, as the stock pushed to the top of its recent trading band and came within reach of its 3-month high of 211.34. The move matters because it is not just a one-day bounce: CRM is now above its SMA20 at 187.87 and above its SMA50 at 173.23, a position that signals the shares are still trading in an established uptrend rather than merely reacting to a short-term headline.
Trend & Price Action
The chart shows a stock that has moved from recovery to extension. With CRM up 26.44% over one month and the SMA20 rising 3.88% over five days, the trend is not only upward but also gaining slope. That slope matters: a rising short-term average usually means recent prices are being accepted at higher levels, not rejected. In plain terms, the market is paying up for the shares and has not yet signaled a loss of trend control.
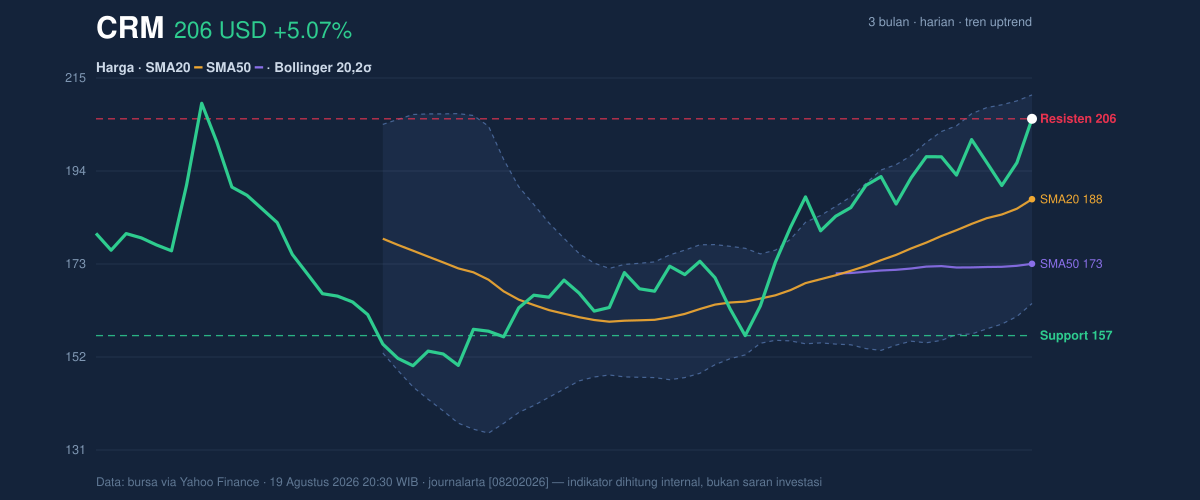
The current reading also sits at 100% of the 20-hour range, which means the stock is pressing right against the upper edge of its short-term band rather than consolidating in the middle. That positioning often reflects strength, but it can also leave less room for immediate follow-through unless buyers keep showing up. The lack of a fresh MA-cross is important here: the bullish structure already exists because price is above both moving averages, but the move is being driven by trend persistence rather than a new crossover event.
Oscillators & Momentum
Momentum is supportive, but not cleanly unburdened. The RSI at 64.8 is still in neutral territory, which suggests the stock is not yet in a full overbought condition on that measure. That leaves room for further upside without immediately flashing a classic exhaustion warning. The stronger caution comes from the stochastic oscillator, where %K at 94.0 and %D at 72.6 show the shares are overbought. For general readers, that means the stock has climbed quickly enough that it may be vulnerable to pauses or pullbacks, even if the broader trend remains intact.
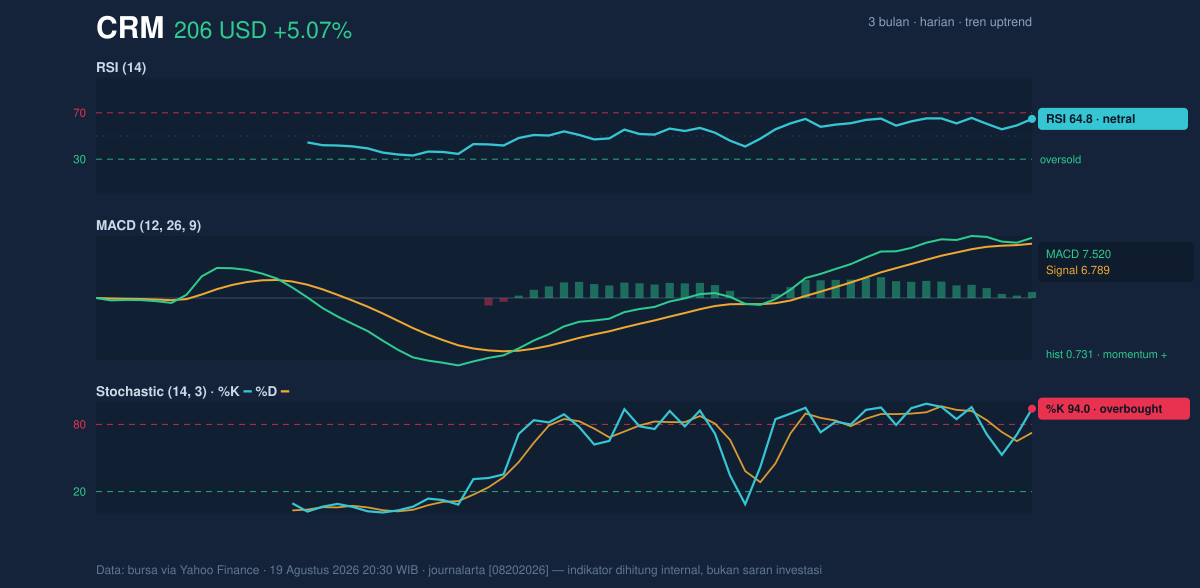
The MACD at 7.520 remains above its signal line at 6.789, with a positive histogram of 0.731. That combination is important because MACD is a trend-following indicator: when it stays above the signal line, it suggests upward momentum is still leading the tape. In other words, the stock is not just overextended; it is still advancing with trend confirmation. The tension between a strong MACD and an overbought stochastic often means the trend is still alive, but the next move may be more volatile than directional.
Volatility & Volume
Volatility is elevated. The Bollinger Bands are widening, with the upper band at 211.51, the middle band at 187.87, and the lower band at 164.22; the 25.2% band width and ATR of 8.19 confirm that price swings are larger than usual. ATR, or average true range, is a measure of daily movement; at 4.0% of price, it says CRM can move meaningfully in either direction without changing the bigger trend. The current %B of 89% means price is trading very close to the upper band, which usually indicates strength but also a higher chance of short-term mean reversion if buyers pause.
Volume supports the move. Last trade volume of 17,839,300 was about 1.4× normal versus the 20-hour average of 12,924,775, and OBV is rising. That combination matters because rising volume and on-balance volume suggest the advance is being backed by participation, not just thin trading. When volume expands while price pushes higher, it often means institutions and larger holders are still involved. If volume were fading, the rally would look more fragile; here, participation is still present.
Key Levels & Scenarios
The immediate reference points are clear. On the downside, 206.09 is the latest price and also the top of the 20-hour range, so any slip below that area would be the first sign that the latest push is losing urgency. Below that, the 20-hour support at 156.93 is the deeper technical floor from the data set, while the SMA20 at 187.87 is the key trend line that often acts as a magnet during pullbacks. On the upside, the next visible ceiling is the upper Bollinger Band at 211.51, closely aligned with the 3-month high at 211.34. That pairing is important because price often hesitates where prior highs and volatility bands overlap.
If CRM pushes through the 211.34–211.51 zone, the chart would be signaling a fresh breakout attempt above recent resistance. If it fails to hold above the SMA20 at 187.87, the tone shifts from trend continuation to consolidation, and the move would look more like an exhausted rally than a sustained advance.
Technical Verdict: HOLD (wait & see)
HOLD (wait & see)
- MACD stays positive, which keeps trend momentum constructive.
- Price remains above SMA20 and SMA50, confirming the broader uptrend is intact.
- Stochastic is overbought and %B is near the upper Bollinger Band, so the stock may need to cool off before extending further.
Verdict invalidated if price falls below 187.87, because that would mean CRM has lost its short-term trend anchor.
- Ideal Entry Range: 187.87 to 206.09
- Exit Target: 211.34 to 211.51
- Stop Loss protection: below 187.87
In plain English: the stock still looks strong, but it is close enough to resistance that the next move may be a pause rather than a straight line higher.
Salesforce closed the session with OBV rising and volume at 17,839,300.
Summary Data CRM
| Last price | 206.09 USD |
| Change 1 day / 5 days / 1 month | 5.07% / 6.61% / 26.44% |
| Trend / MA-cross | uptrend / none |
| SMA20 / SMA50 | 187.87 / 173.23 |
| RSI (14) / Stochastic %K | 64.8 / 94.0 |
| Bollinger %B / ATR | 89% / 8.19 |
| Support / Resistance 20 days | 156.93 / 206.09 |
| Data as of | 19 Agustus 2026 20:30 WIB |
Track CRM stock price daily: live levels, support/resistance and our full CRM analysis history.