Momentum Gains, OCBC Stock Drops 1.93% Today
On Agustus 20, 2026: price 30.94 SGD, trend uptrend, RSI 66.1, support 28.63, resistance 31.79. technical analysis of ocbc stock. Momentum Gains — full details…

OCBC Bank’s shares on SGX were last quoted at SGD 30.94, down 1.93% from the previous close of 31.55, even as the broader technical picture still points to an established uptrend. The pullback matters less as a trend break than as a test of how much profit-taking the stock can absorb after a 1-month gain of 7.84%. As shown in the chart, the stock remains above its short- and medium-term moving averages, which tells traders the recent dip is happening inside a still-intact upward structure rather than against it.
Trend & Price Action
The first signal is the position of price versus trend lines: OCBC is trading above SMA20 at 29.81 and well above SMA50 at 27.30. That gap is important because it suggests buyers have been willing to pay up over both the last month and the last two months, not just during a brief bounce. The SMA20 slope of 2.53% over five days reinforces that the short-term trend is still rising, while the absence of a fresh MA-cross means the move is being carried by continuation rather than a dramatic new technical trigger.
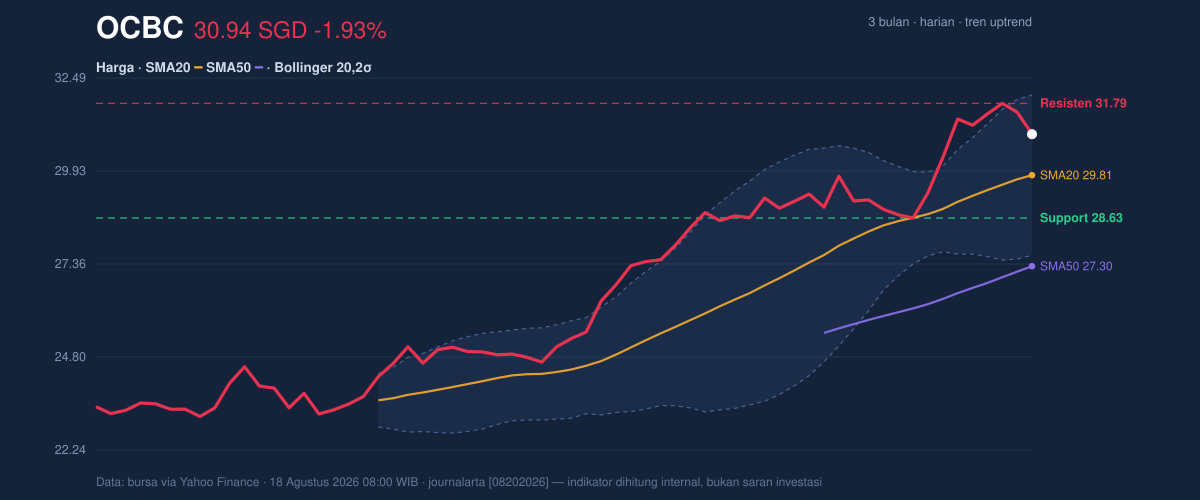
Price is also sitting at about 73% of the 20-day range, with 20-day support at 28.63 and 20-day resistance at 31.79. That placement is a useful clue: the stock is not languishing near support, but neither has it cleanly escaped the range. It is closer to the upper end, which usually means momentum is still constructive, though the market is asking whether the next push can clear the ceiling. The 3-month high of 31.86 sits just above current levels, so the chart is now pressing against an area where prior advances have stalled.
Oscillators & Momentum
Momentum indicators are mostly aligned with the trend, but not in a way that screams urgency. The RSI at 66.1 is described as neutral, yet it is near the upper end of the range and signals that the stock is strong without being in obvious overheated territory. In plain language, that means there is still room for buyers, but less comfort for late entrants than when RSI was lower. The Stochastic %K at 72.7 and %D at 87.1 are also neutral, but the pair shows the faster line below the slower one, a setup that often reflects momentum losing some pace after a strong run.
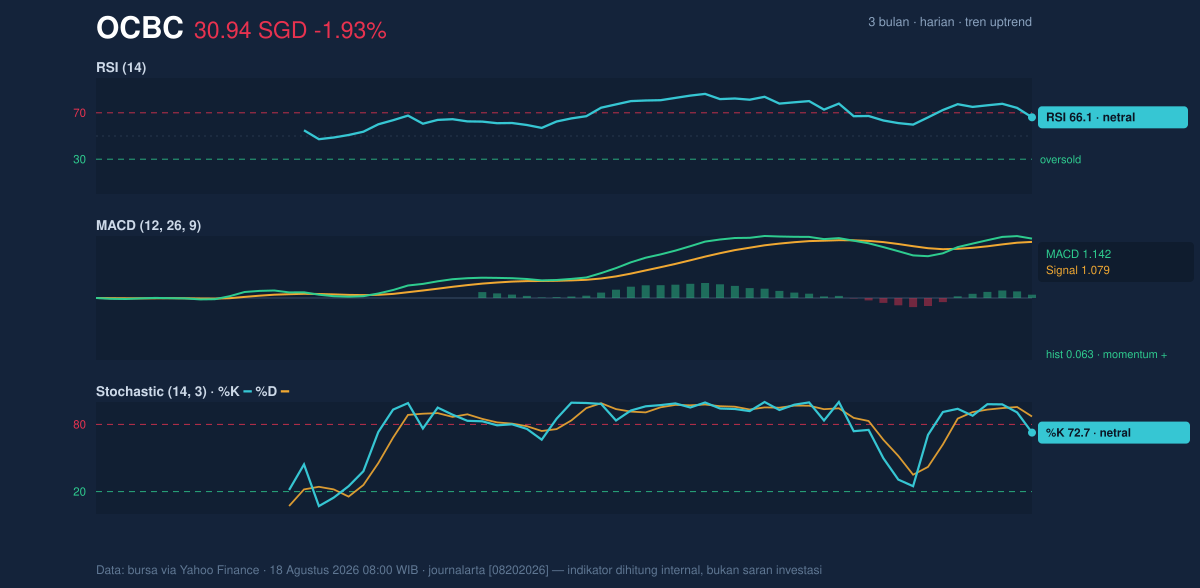
The more encouraging part is the MACD at 1.142, above its signal line at 1.079, with a positive histogram of 0.063. MACD measures whether the shorter-term trend is outpacing the longer one, so a positive reading and positive spread usually mean trend energy is still intact. Here, that positive signal offsets the softer stochastic picture. Put simply: the stock is not showing a strong reversal warning; it is showing a mature advance that may need consolidation before another clean push.
Volatility & Volume
The Bollinger Bands give a similar message. OCBC is trading near the upper band at 32.02, with the middle band at 29.81 and the lower band at 27.60. Its %B reading of 76% says price is closer to the top of the band than the middle, which generally means the stock is carrying bullish pressure but may be stretched relative to its recent average. The 14.8% band width is normal, not squeezed, so this is not the kind of setup that usually precedes a violent breakout on its own. Instead, it points to a market already moving, with room for continuation if volume confirms.
That confirmation is mixed but still constructive. Last volume of 7,077,400 was almost exactly in line with the 20-day average of 7,254,303, or about 1.0× normal. In other words, the latest dip was not accompanied by a major surge in selling interest. The OBV is rising, which matters because on-balance volume tracks whether money flow is accumulating over time. Rising OBV alongside a price that remains above key averages usually indicates that buyers have not abandoned the trend, even if the stock pauses for breath.
Key Levels & Scenarios
The immediate technical battleground is clear. 31.79 is the nearest resistance from the 20-day range, and 31.86 is the 3-month high just above it. A decisive move through that zone would show the market is willing to accept the stock at a fresh high, which would strengthen the current uptrend. On the downside, 28.63 is the first support to watch; a break below that would mark a deterioration in the recent price structure and would also pull the stock back toward the Bollinger middle band at 29.81 and the SMA20.
The ATR(14) of 0.71, equal to 2.3% of price, suggests normal daily movement rather than unusually wide swings. That is useful context: if the stock does break its range, the move is more likely to unfold in measured steps than in a single dramatic leap. For now, the chart is saying OCBC is in a steady advance, but one that is close enough to resistance that each new attempt higher will need proof.
Technical Verdict: HOLD (wait & see)
HOLD (wait & see)
- MACD is positive and above its signal line, which supports the existing uptrend.
- Price remains above SMA20 and SMA50, so the broader structure is still constructive.
- RSI and Stochastic are near the upper end of neutral, while price is close to the upper Bollinger Band, which argues for patience rather than chasing strength.
Verdict invalidated if price falls below 28.63, which would weaken the short-term range and challenge the current trend structure.
- Ideal entry range: 29.81 to 28.63
- Exit target: 31.79 to 31.86
- Stop loss protection: below 28.63
In plain English, the chart still looks healthy, but the stock is close enough to resistance that it makes more sense to wait for either a cleaner breakout or a better pullback.
Summary Data OCBC
| Last price | 30.94 SGD |
| Change 1 day / 5 days / 1 month | -1.93% / -1.34% / 7.84% |
| Trend / MA-cross | uptrend / none |
| SMA20 / SMA50 | 29.81 / 27.30 |
| RSI (14) / Stochastic %K | 66.1 / 72.7 |
| Bollinger %B / ATR | 76% / 0.71 |
| Support / Resistance 20 days | 28.63 / 31.79 |
| Data as of | 18 Agustus 2026 08:00 WIB |
Track OCBC share price daily: live levels, support/resistance and our full OCBC analysis history.