NFLX Stock Gains 3.15% Today, Testing Key Resistance
On Agustus 20, 2026: price 80.22 USD, trend sideways, RSI 63.8, support 68.89, resistance 80.22. technical analysis of nflx stock. NFLX Stock Gains — full…

Netflix Inc. shares on the NASDAQ rose to 80.22 USD in the latest session, up 3.15% on the day and 17.06% over the past month, according to Yahoo Finance data cited at 19 August 2026 20:30 WIB. The move matters because it pushed the stock to the very top of its recent trading band, where momentum often looks strongest but also most vulnerable to a pause. The chart shows a market that has recovered sharply from earlier weakness, yet is now testing whether that rebound can extend beyond a well-defined ceiling.
Trend & Price Action
Netflix is still described as sideways, but that label hides an important detail: the slope of SMA20 at 2.93% over 5 days shows the short-term trend has turned upward even though the broader structure has not produced a fresh moving-average crossover. With the share price sitting above SMA20 at 74.25 and just over SMA50 at 74.59, the stock has reclaimed both of the key reference lines traders use to judge whether a rebound is gaining traction. That positioning usually signals improving demand, but not yet a full trend reversal.
The range tells the same story in sharper form. The latest price is at 100% of the 20-hour range, with support at 68.89 and resistance at 80.22. In practical terms, the stock is not just rising; it has reached the upper boundary of its current channel. That can be constructive if buyers keep showing up, but it also means the market has already done much of the easy work for the move.
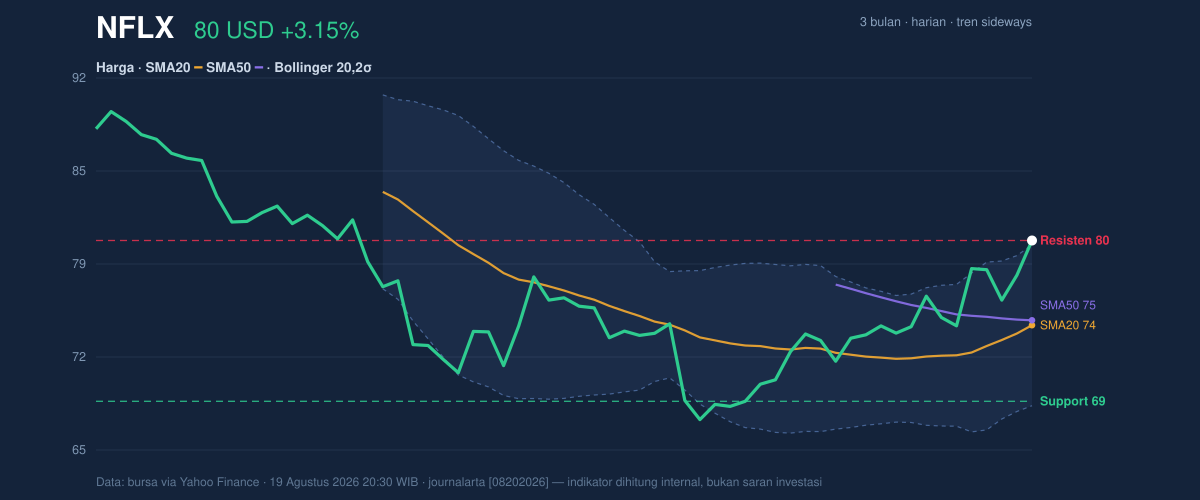
The three-month range adds context. Netflix is trading well above the 3-month low of 65.08, but still below the 3-month high of 90.37. That gap suggests the stock has room to rebuild, yet it has not fully repaired the damage from the earlier drawdown. The current setup is less a breakout than a test of whether the recovery can mature into something stronger.
Oscillators & Momentum
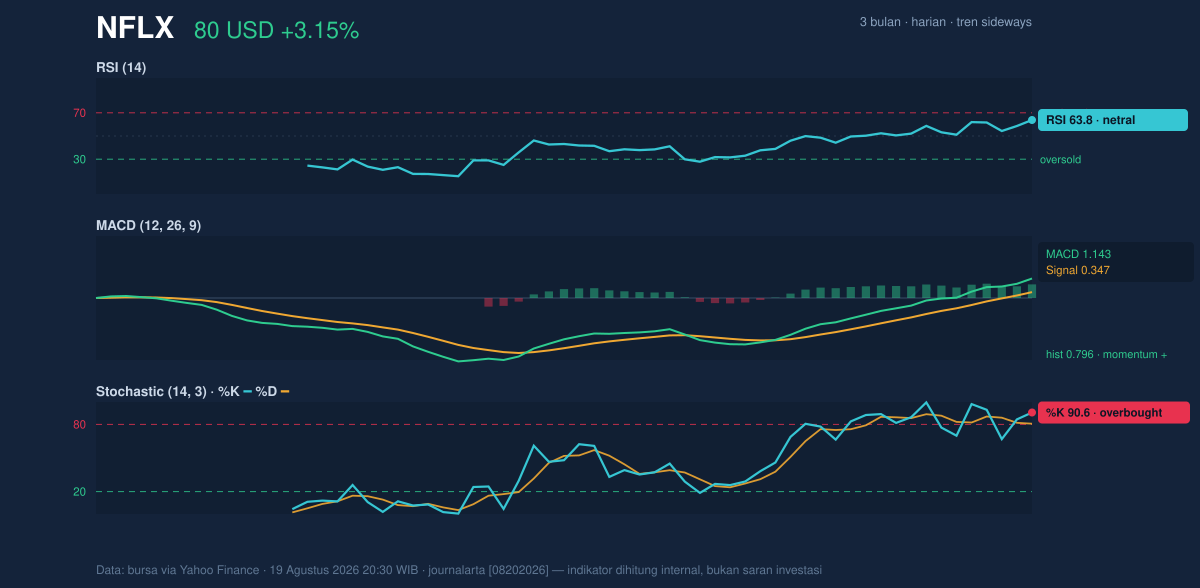
The momentum picture is mixed, and that mix is what makes this name interesting right now. RSI at 63.8 is still technically neutral, which means the stock is not yet in the classic overheated zone. But Stochastic %K at 90.6 and %D at 80.7 are both in overbought territory, a sign that recent gains have come quickly enough to stretch short-term momentum. For readers, the Stochastic oscillator is a speedometer for the latest price move: when it gets this high, the market is often running hot, even if the broader trend remains intact.
That tension is reinforced by the MACD. MACD at 1.143 remains above the signal line at 0.347, and the histogram at 0.796 shows the positive gap has widened. In plain English, the stock’s upward impulse is still active, and the trend-following indicator has not rolled over. The signal is constructive, but it is also being paired with overbought short-term oscillators, which often means the next phase is consolidation rather than a straight-line advance.
That is the key nuance.
Momentum is positive, but it is not unchallenged.
Volatility & Volume
Bollinger Bands help frame how extended the move has become. With the upper band at 79.92, the middle band at 74.25 and the lower band at 68.57, Netflix is trading just above the upper boundary, while %B at 103% confirms price has pushed beyond the band itself. That usually means the move is strong enough to force attention, but it can also indicate a short-term stretch that leaves less room for immediate follow-through. The 15.3% band width is described as normal, so this is not a compression breakout story; it is more a case of price pressing into the top of an ordinary volatility envelope.
Volatility is also supported by ATR(14) at 2.32, or 2.9% of price. ATR measures the average daily movement, and here it says the stock is capable of moving enough to matter without being unusually wild. That matters because a stock sitting at resistance with moderate volatility can still break higher, but it can also retreat quickly if buyers hesitate.
Volume is less convincing. The latest print of 31,407,400 shares was only 0.9x the 20-day average of 35,214,505. In other words, the stock advanced without a full surge in participation. That does not negate the move, but it does limit the strength of the confirmation. The encouraging counterweight is OBV rising, which suggests cumulative buying pressure has been improving even if the latest session did not come with exceptional turnover.
Key Levels & Scenarios
The immediate battleground is clear. Resistance at 80.22 has been reached exactly, so the market is now asking whether this level becomes a launching point or a ceiling. On the downside, SMA20 at 74.25 and SMA50 at 74.59 are the first important cushions, while support at 68.89 is the deeper line that would signal the rebound is losing shape.
If the stock holds above the moving averages and keeps the MACD positive, the chart would favor a continued attempt toward the 3-month high of 90.37. If, instead, price slips back below the mid-70s, the overbought Stochastic reading would start to look more like exhaustion than strength.
Technical Verdict: HOLD (wait & see)
The setup is constructive, but not clean enough for a one-direction technical call. The strongest reasons are price above SMA20 and SMA50, MACD still positive with a rising histogram, and OBV trending higher, which together show improving trend quality. The caution comes from Stochastic overbought readings, price above the upper Bollinger Band, and volume below average, all of which suggest the move may need to cool before it can extend.
- Ideal Entry Range: 74.59 to 79.92
- Exit Target: 90.37
- Stop Loss protection: 68.89
Verdict invalidated if price falls below 68.89.
In plain English: the stock looks healthy, but it is already stretched enough that patience makes more sense than chasing the move at the current level.
Summary Data NFLX
| Last price | 80.22 USD |
| Change 1 day / 5 days / 1 month | 3.15% / 8.10% / 17.06% |
| Trend / MA-cross | sideways / none |
| SMA20 / SMA50 | 74.25 / 74.59 |
| RSI (14) / Stochastic %K | 63.8 / 90.6 |
| Bollinger %B / ATR | 103% / 2.32 |
| Support / Resistance 20 days | 68.89 / 80.22 |
| Data as of | 19 Agustus 2026 20:30 WIB |
Track NFLX stock price daily: live levels, support/resistance and our full NFLX analysis history.