NKE Stock Gains 2.47% Today, Momentum Weakens
On Agustus 20, 2026: price 41.05 USD, trend downtrend, RSI 46.6, support 39.09, resistance 43.22. technical analysis of nke stock. NKE Stock Gains — full…

Nike shares rose to 41.05 USD on the NYSE, up 2.47% from the previous close of 40.06, but the move still leaves the stock below its short- and medium-term trend markers, a sign that traders are treating the bounce as a test rather than a confirmed reversal. As shown in the chart, the price remains under SMA20 at 41.58 and well below SMA50 at 42.65, while the broader setup still points to a downtrend. That matters because in technical analysis, being below both moving averages usually means rallies are running into overhead supply — investors who bought higher may use rebounds to reduce exposure, which can cap advances.
Trend & Price Action
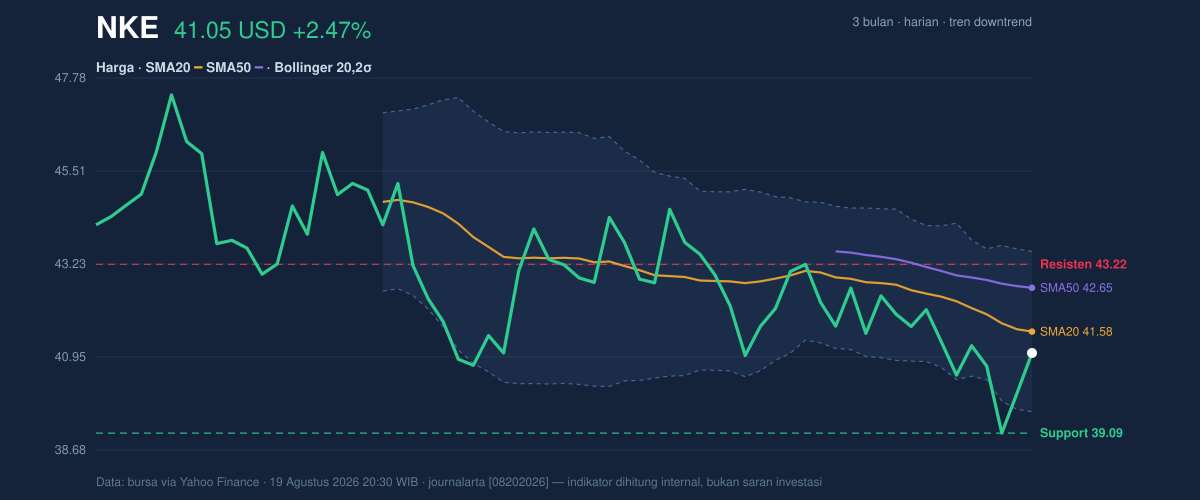
The chart shows Nike trading in the lower half of its recent range, with price sitting at 47% of the 20-hour span between support at 39.09 and resistance at 43.22. That positioning is important: the stock is not pressing the floor, but it is also not close enough to the ceiling to suggest momentum is in control. The fact that the SMA20 is sloping down by 1.75% over 5 days reinforces the idea that short-term trend pressure is still leaning lower. With no fresh MA-cross, there is no moving-average signal yet to suggest a regime change. In plain language, the stock has bounced, but the trend has not turned.
A small gain can still sit inside a larger decline.
The Bollinger Bands add the same message with slightly more nuance. Nike is trading below the middle band at 41.58, with %B at 37%, which means price is closer to the lower half of the band structure than the upper half. That does not signal panic; instead, it suggests the stock is recovering from weakness but has not rebuilt enough strength to challenge the upper band at 43.54. The band width of 9.4% is described as normal, so this is not a compression setup that often precedes a sharp breakout. For readers, that means the market is not currently storing up energy for an obvious volatility burst.
Oscillators & Momentum
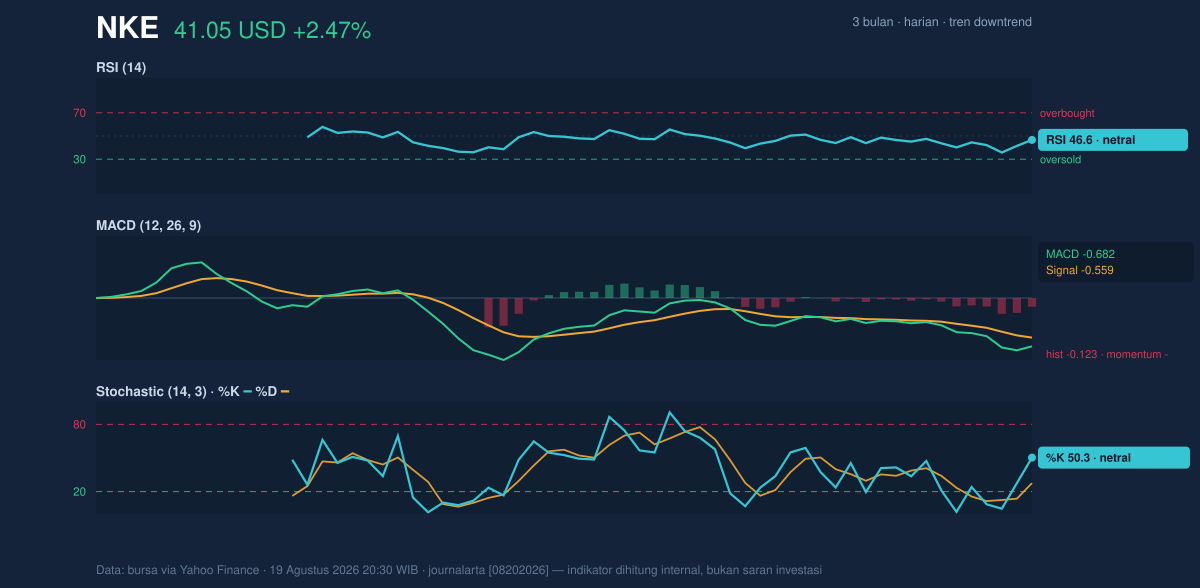
Momentum indicators are mixed, and that mix is telling. The RSI at 46.6 is neutral, which means neither buyers nor sellers have a strong momentum edge. The Stochastic %K at 50.3 and %D at 27.6 is also neutral, but the spread between the two lines suggests the stock has improved from weaker levels without yet establishing a strong bullish thrust. In simple terms, momentum has stopped deteriorating sharply, but it has not flipped decisively upward.
The more cautionary signal is the MACD at -0.682, with the signal line at -0.559 and a histogram of -0.123. MACD compares shorter- and longer-term price momentum; when it sits below zero and below its signal line, it usually means downward pressure is still present even if the stock is bouncing. The negative histogram shows that bearish momentum is still slightly stronger than the recovery effort. That is why the rally looks more like stabilization than confirmation.
Volatility & Volume
Nike’s ATR(14) of 1.16, equal to 2.8% of price, points to moderate volatility. This matters because it suggests the stock can move enough in either direction to matter, but not so violently that every session resets the picture. For traders and investors watching the tape, moderate ATR means the next push through a level could be meaningful, especially if it comes with volume.
But volume is not yet providing that confirmation. Last session’s volume was 22,026,500, below the 20-hour average of 24,703,840, or about 0.9× normal. That tells you the bounce happened without full participation. When price rises on lighter volume, the move can reflect short covering or temporary bargain hunting rather than broad conviction. The OBV is falling, which is another warning sign: On-Balance Volume tracks whether money flow is accumulating or leaving the stock, and a declining OBV alongside a price rebound often means the underlying bid is still weak.
Key Levels & Scenarios
The nearest technical battleground is clear. Support at 39.09 is the first level that would matter if the bounce fades, while resistance at 43.22 is the first ceiling that bulls would need to clear to show the recovery has substance. Above that, the SMA50 at 42.65 and the Bollinger upper band at 43.54 form a clustered overhead zone, which means the stock may need more than one session of firm buying to escape the current range. On the downside, the Bollinger lower band at 39.61 sits close to support, making the area around 39 to 40 a key test of whether buyers are defending the recent base.
If price can hold above 41.58 and then reclaim 42.65, the structure would begin to improve because the stock would be pushing back through the levels that currently define weakness. If it fails and slips under 39.09, the chart would lose its nearest support cushion and the current rebound would look more like a pause inside a broader downtrend. The 3-month range also frames the story: the stock is still well below the 47.65 high and only modestly above the 38.86 low, so it remains closer to the lower end of the larger range than to recovery territory.
Technical Verdict: HOLD (wait & see)
HOLD (wait & see) is the clearest reading because the stock is bouncing, but the trend and momentum signals have not yet aligned in a convincing way.
- Reason 1: Price is still below SMA20 at 41.58 and SMA50 at 42.65, with the SMA20 sloping down, which keeps the short-term trend bearish.
- Reason 2: MACD remains negative and below its signal line, showing bearish momentum is still active.
- Reason 3: Volume is 0.9× normal and OBV is falling, so the rebound lacks strong participation.
- Verdict invalidated if price breaks below 39.09, because that would mean the nearest support has failed and the current base has not held.
- Ideal Entry Range: 39.61 to 41.58
- Exit Target (Target Price): 42.65 to 43.54
- Stop Loss protection: below 39.09
For non-traders, this means Nike is trying to recover, but the chart still wants proof before calling the move durable.
“The stock is alive, but it still has to prove it can stand on its own.”
Summary Data NKE
| Last price | 41.05 USD |
| Change 1 day / 5 days / 1 month | 2.47% / 1.33% / -2.75% |
| Trend / MA-cross | downtrend / none |
| SMA20 / SMA50 | 41.58 / 42.65 |
| RSI (14) / Stochastic %K | 46.6 / 50.3 |
| Bollinger %B / ATR | 37% / 1.16 |
| Support / Resistance 20 days | 39.09 / 43.22 |
| Data as of | 19 Agustus 2026 20:30 WIB |
Track NKE stock price daily: live levels, support/resistance and our full NKE analysis history.