PDD Stock Technicals Today: Gains 3.36%, Momentum Weakens
On Agustus 20, 2026: price 90.20 USD, trend uptrend, RSI 56.6, support 82.66, resistance 93.00. technical analysis of pdd stock. PDD Stock Technicals — full…

PDD Holdings is trading higher, but the chart is saying that the rally still needs proof. The stock last changed hands at 90.20 USD, up 3.36% on the day, and it is now sitting in the upper part of its recent trading range, according to Yahoo Finance data cited by the exchange feed.
The move matters for international readers because PDD sits at the center of Temu’s cross-border consumer story, where sentiment can shift quickly between growth enthusiasm and concern over sustainability. On the tape, the current price is above the short- and medium-term trend markers, yet one of the key momentum gauges has not fully confirmed the advance.
Trend & Price Action
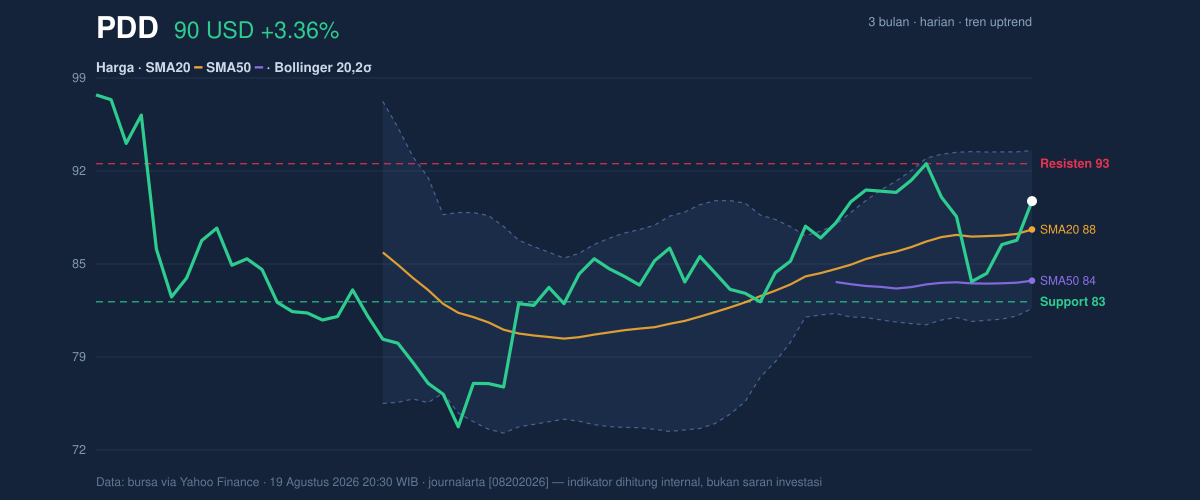
The first signal is constructive. PDD is trading above its SMA20 at 88.07 and well above its SMA50 at 84.24, which tells traders that the recent price structure is still aligned with an uptrend. The SMA20 slope of 0.46% over 5 days suggests the short-term trend is still rising rather than flattening out.
That said, the stock is not breaking away decisively. With the price at 90.20 and the Bollinger middle band also at 88.07, PDD is above the average short-term trading line but not yet close to the upper band at 93.99. In plain language, the market is rewarding the stock, but it has not entered the kind of stretched move that usually signals a runaway breakout.
The 20-hour support and resistance map adds the same message. The stock is trading near 73% of the recent range, with 82.66 as support and 93.00 as resistance. That placement shows buyers have control for now, but the stock is still below the ceiling that would turn the move into something more convincing.
Oscillators & Momentum
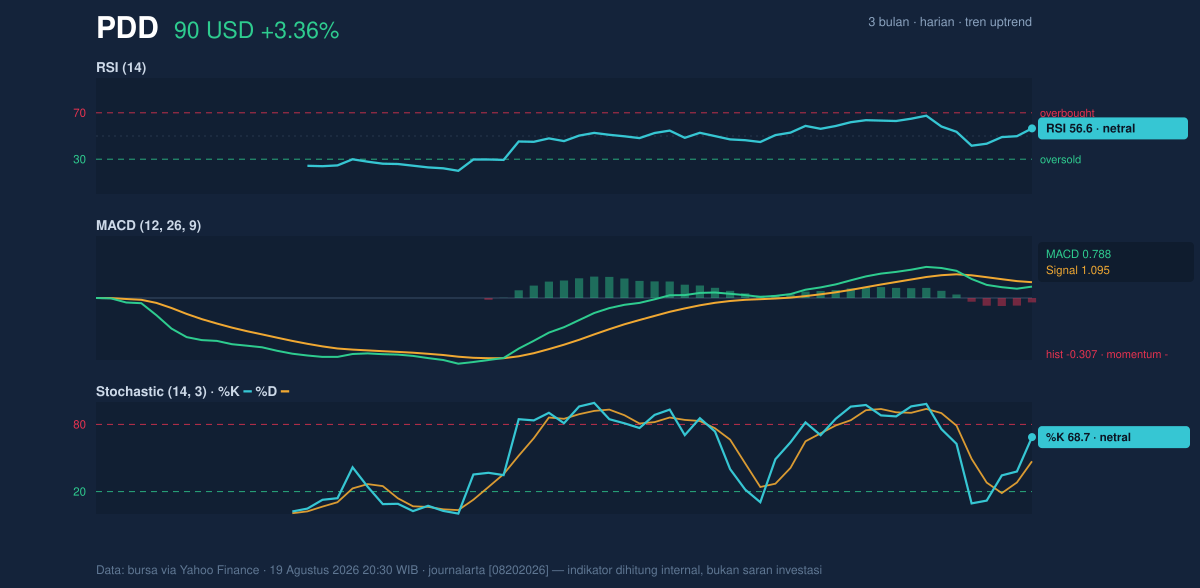
The momentum picture is mixed rather than bullish. The RSI at 56.6 is neutral, which means the stock is neither overbought nor oversold. That is important because it suggests the recent rise has room to continue, but it is not backed by the kind of strong momentum that often accompanies a fresh trend acceleration.
The stochastic oscillator is a little more encouraging on the surface. %K at 68.7 is above %D at 47.0, which usually indicates improving short-term momentum. But because both readings remain in neutral territory, this is better read as a stabilizing signal than a full-blown bullish trigger.
The caution flag comes from MACD. MACD at 0.788 is still below the signal line at 1.095, leaving a histogram of -0.307. That negative histogram means the recent price rise has not yet translated into stronger trend momentum. In other words, the stock is climbing, but the underlying thrust is still catching up.
Volatility & Volume
Volatility is present, but not extreme. The ATR at 2.25, or 2.5% of price, points to moderate daily movement. That matters because a stock with moderate ATR can move enough to test levels without behaving like a panic-driven name. The Bollinger Band width of 13.4% is described as normal, which argues against a squeeze setup or a volatility breakout already being in motion.
The position inside the Bollinger envelope is also useful. With %B at 68%, price is above the midpoint and leaning toward the upper half of the band, but not pressing the top edge. That usually means buyers are present, though not yet forcing an overextended condition.
Volume supports the move, but only modestly. Last volume was 6,259,400 versus a 20-day average of 5,771,610, or 1.1× normal. That is enough to say the advance has participation, and the OBV is rising, which indicates cumulative buying pressure is still improving. But the volume edge is not dramatic, so this remains a confirmation signal rather than a decisive surge.
Key Levels & Scenarios
The market structure is clear enough to frame the next test. Immediate support sits at 82.66, while the nearest resistance is 93.00. Beyond that, the upper Bollinger band at 93.99 becomes the next technical marker to watch. The recent 3-month high of 98.40 remains the broader upside reference, while 71.94 is the lower end of the 3-month range.
If price can push through 93.00 and hold above the upper band area near 93.99, the chart would begin to show stronger trend extension rather than just a rebound within range. If it fails to clear that zone, the stock may continue to trade in a broad band between the midline and resistance, with momentum indicators needing time to reset.
A break back below 88.07 would weaken the short-term trend argument because that is both the SMA20 and the Bollinger middle band. A drop through 82.66 would be more serious, since it would put the recent range floor under pressure and challenge the idea that buyers are still defending the trend.
Technical Verdict: HOLD (wait & see)
HOLD (wait & see) is the cleanest reading because the stock is trending above key moving averages, but the momentum stack is not fully aligned yet.
- Reason 1: Price is above the SMA20 at 88.07 and SMA50 at 84.24, which keeps the trend constructive.
- Reason 2: RSI 56.6 and Stochastic %K 68.7 / %D 47.0 are neutral-to-improving, but not strong enough to confirm a breakout.
- Reason 3: MACD 0.788 below signal 1.095 with a -0.307 histogram shows momentum is still lagging price.
- Verdict invalidated if price breaks below 82.66, because that would damage the recent range structure and weaken the uptrend case.
- Ideal Entry Range: 88.07 to 90.20, where price is near the short-term trend line and still inside the current structure.
- Exit Target: 93.00 to 93.99, matching resistance and the upper Bollinger band.
- Stop Loss protection: 82.66, the nearest support and recent range floor.
For non-traders, this means the stock is rising, but the chart is still asking for confirmation before the move can be trusted. “The trend is healthier than the momentum, and that gap is exactly what the market has to close next.”
Summary Data PDD
| Last price | 90.20 USD |
| Change 1 day / 5 days / 1 month | 3.36% / 1.30% / 7.91% |
| Trend / MA-cross | uptrend / none |
| SMA20 / SMA50 | 88.07 / 84.24 |
| RSI (14) / Stochastic %K | 56.6 / 68.7 |
| Bollinger %B / ATR | 68% / 2.25 |
| Support / Resistance 20 days | 82.66 / 93.00 |
| Data as of | 19 Agustus 2026 20:30 WIB |
Track PDD stock price daily: live levels, support/resistance and our full PDD analysis history.