RSI Overbought, MRK Stock Gains 12.60% Today
On Agustus 20, 2026: price 152.20 USD, trend uptrend, RSI 83.1, support 127.77, resistance 152.20. technical analysis of mrk stock. RSI Overbought — full…

Merck is trading at the top of its recent range, with the latest print at 152.20 USD after a sharp 12.60% one-day rise, a move that has pushed the stock into a technically stretched zone even as the broader trend remains firmly upward. For international readers, the key question is not whether the rally is strong — it is — but whether the current pace is being supported by enough participation to hold.
Trend & Price Action
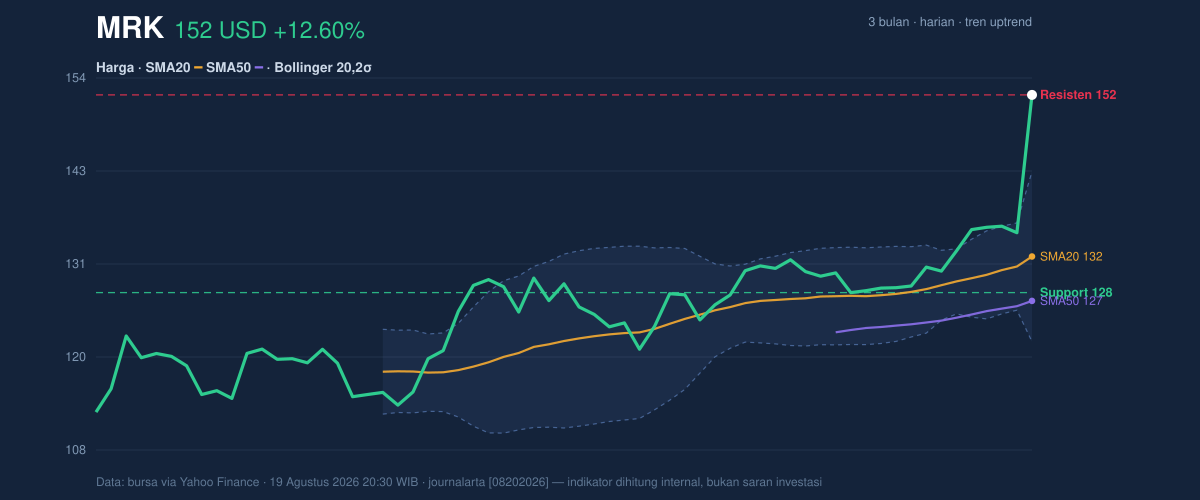
The chart shows a stock that is still structurally constructive. MRK is above its SMA20 at 132.23 and above its SMA50 at 126.74, which means the short-term price is trading above both its recent average and its medium-term average. In plain language, that often signals that buyers have been in control for long enough to lift the baseline higher, not just produce a one-day spike. The SMA20 slope of 2.38% over 5 days reinforces that the trend is rising rather than flattening out.
What makes this move more striking is where price sits inside the range. 152.20 is also the current 20-hour resistance, and it is essentially at the top of the 3-month high/low band of 153.50 / 111.57. That tells investors the stock is pressing against an area where earlier advances have recently stalled. In other words, the trend is strong, but the market is now testing how much enthusiasm is left after a fast climb.
A short burst higher can be powerful. It can also leave little room for error.
Oscillators & Momentum
The momentum picture is where the caution begins. RSI at 83.1 and Stochastic %K at 95.2 with %D at 86.8 both indicate an overbought condition. For general readers, overbought does not mean the stock must fall immediately; it means the recent advance has been so fast that momentum indicators are warning the move may be extended relative to recent history. That often happens near short-term peaks, especially after a strong volume surge.
At the same time, the trend has not yet rolled over. MACD is 3.908 versus a signal line of 2.455, with a positive histogram of 1.452. That is a classic sign that upside momentum is still ahead of its signal line. Put simply, the trend engine is still running, even if the speedometer is in the red zone.
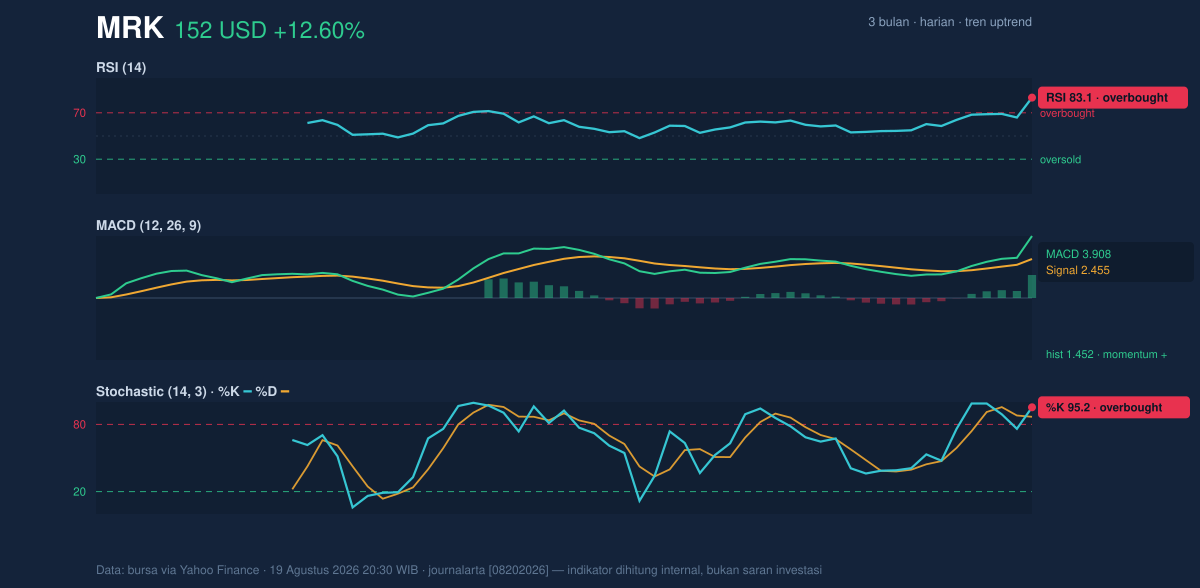
This is the tension in the chart: momentum is positive, but it is also stretched.
Volatility & Volume
Bollinger Bands help frame how far price has moved from its recent average. %B at 145% means the stock is trading above the upper band at 142.74, a condition that often appears during strong breakout attempts or short-lived overshoots. The band width is 15.9%, described here as normal, so this is not a volatility squeeze waiting to explode. Instead, the chart suggests a market that is already moving with meaningful energy, not one that is coiled for a fresh release.
Volume gives that move more credibility. 32,719,300 shares traded versus a 20-hour average of 9,643,940, a 3.4× jump. That matters because breakouts backed by heavy turnover are more likely to reflect broad participation rather than a thin, isolated move. The OBV is rising, which means volume has been flowing in a direction consistent with higher prices. In practical terms, buyers are not just pushing price higher; they are doing so with enough activity to suggest commitment.
Still, strong volume does not erase the overbought reading. It only says the move has been widely engaged.
Key Levels & Scenarios
The nearest technical floor is 127.77 support, which sits below the current price but above the 20-hour average area and marks the level where recent buying interest has previously appeared. The immediate ceiling is 152.20 resistance, which is now being tested in real time. Above that, the chart’s next visible reference is the 3-month high at 153.50. If the stock can hold above the current resistance area, that would suggest the market is willing to accept a new higher trading zone. If it fails, the overbought oscillators raise the odds of a pullback toward the lower band structure.
The ATR at 4.34, or 2.8% of price, indicates moderate volatility. That means daily swings are not unusually wild, but the stock can still move enough for a failed breakout to unwind quickly. In other words, the chart has room to move both ways.
Technical Verdict: HOLD (wait & see)
HOLD (wait & see)
- RSI at 83.1 and Stochastic at 95.2 / 86.8 show the stock is overbought, which often precedes consolidation or a pause.
- MACD remains positive, so the trend is still intact and not yet signaling a clear reversal.
- Volume at 3.4× average and a rising OBV confirm real participation behind the move, but price is already at 152.20 resistance and above the upper Bollinger band at 142.74.
- Verdict invalidated if price breaks below 127.77.
- Ideal Entry Range: 127.77 to 142.74
- Exit Target: 153.50
- Stop Loss protection: 127.77
For non-traders, this means the trend is still strong, but the stock is stretched enough that the chart is asking for proof before the next leg higher.
Summary Data MRK
| Last price | 152.20 USD |
| Change 1 day / 5 days / 1 month | 12.60% / 14.50% / 19.40% |
| Trend / MA-cross | uptrend / none |
| SMA20 / SMA50 | 132.23 / 126.74 |
| RSI (14) / Stochastic %K | 83.1 / 95.2 |
| Bollinger %B / ATR | 145% / 4.34 |
| Support / Resistance 20 days | 127.77 / 152.20 |
| Data as of | 19 Agustus 2026 20:30 WIB |
Track MRK stock price daily: live levels, support/resistance and our full MRK analysis history.