Singtel Stock Drops 0.67% Today, Momentum Gains
On Agustus 20, 2026: price 4.43 SGD, trend sideways, RSI 52.0, support 4.25, resistance 4.61. technical analysis of singtel stock. Singtel Stock Drops — full…

Singapore Telecom (Singtel) edged down to SGD 4.43 on SGX, slipping from 4.46 even as the broader short-term tape still shows a market that is more sideways than decisively weak. The share price is sitting just above the 20-day average, and that positioning matters: it suggests the stock is not breaking down, but it also has not yet proved it can leave the recent range behind.
Trend & Price Action
As shown in the chart, Singtel is trading in a sideways trend with the SMA20 flattening and drifting lower at -0.21% over 5 days. That kind of slope usually signals hesitation rather than conviction. Price is above the SMA20 at 4.42 and also above the SMA50 at 4.39, which keeps the medium-term structure intact, but the absence of a fresh moving-average cross means the chart has not delivered a new trend signal.
The placement inside the range is also telling. With the stock around the middle of the 20-hour support at 4.25 and resistance at 4.61, the market is effectively waiting for a catalyst. The 3-month low at 4.15 is still comfortably below current trading, so there is no immediate sign of a breakdown. At the same time, the 3-month high at 5.05 remains a distant ceiling, which helps explain why the shares have been drifting rather than trending sharply.
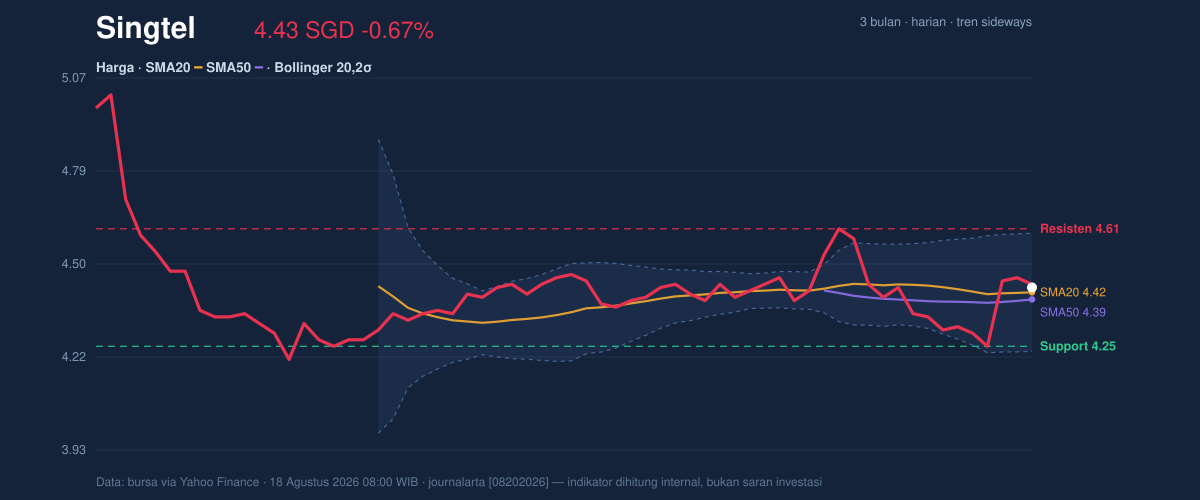
The Bollinger Bands reinforce that message. The stock is near the middle band at 4.42, with %B at 54%, meaning price is only slightly above the midpoint of its recent volatility envelope. In plain terms, the market is balanced, not stretched. The 8.2% band width is normal, so there is no squeeze suggesting an imminent explosive move, but neither is there a volatility expansion warning of panic selling. That combination usually points to consolidation.
Oscillators & Momentum
Momentum indicators are neutral to mildly constructive, which is a better signal than the price drift alone might suggest. The RSI at 52.0 sits just above the midpoint, so the stock is neither overbought nor oversold. That matters because it leaves room for either direction without needing an immediate reset.
The Stochastic %K at 49.0 and %D at 51.0 is also neutral, with no clear bullish or bearish crossover. This tells readers the short-term swing rhythm is balanced; neither buyers nor sellers have seized control. The MACD is the more interesting part of the picture. With MACD at -0.013, the line is still slightly below zero, but it is above the signal line at -0.017, and the histogram is positive at 0.004. That combination means downside momentum has eased and the stock is trying to build a modest positive turn, even though the broader trend has not fully confirmed it.
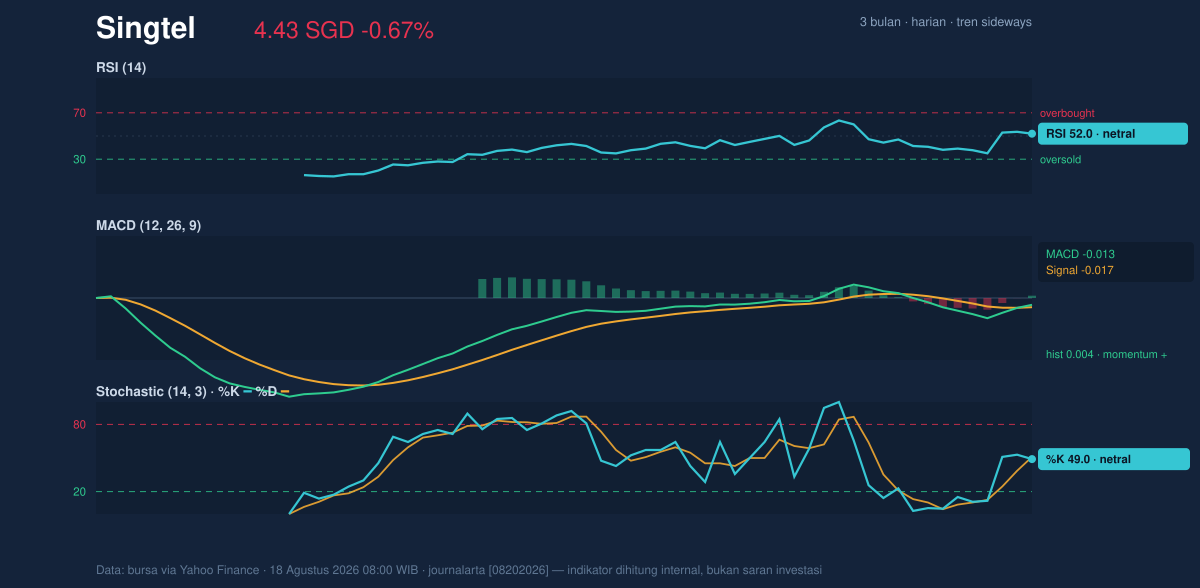
Put simply, momentum is not strong enough to call a breakout, but it is also not flashing a reversal warning. The indicators are aligned in a “wait for proof” setup, where price needs to move before the oscillators can matter more decisively.
Volatility & Volume
Volume is the clearest caution flag in the data. Last trade volume was 18,079,800, well below the 20-day average of 33,909,428, or about 0.5x normal activity. That says participation was thin. When a stock moves on weak volume, the move is less convincing because fewer market participants are confirming the price action.
The OBV is falling, which is another sign that accumulation is not yet overpowering distribution. OBV, or on-balance volume, tracks whether volume tends to arrive on up days or down days. A falling OBV while price holds range support often means buyers are present, but not forceful enough to dominate. In other words, the market is not rejecting the stock, but it is not aggressively bidding it up either.
ATR adds a useful practical layer. The ATR(14) at 0.10, or 2.3% of price, indicates moderate daily movement. That is enough for meaningful swings, but not enough to imply a disorderly tape. Combined with the normal Bollinger width, the setup suggests Singtel is moving within a controlled band rather than entering a high-volatility phase.
Key Levels & Scenarios
The immediate map is fairly clean. 4.25 is the first support to watch, and it is the level that best defines whether the current sideways structure remains intact. If that floor holds, the stock can continue to work back toward 4.61, the nearest resistance. A move through that zone would be important because it would show that the market is finally accepting higher prices after weeks of range trading.
Below 4.25, the chart would likely lose its short-term balance and shift attention toward the 3-month low at 4.15. Above 4.61, the next reference becomes the broader upper range near 5.05, although that would require stronger participation than the tape is showing now. The key point is that Singtel is not trapped in a bearish structure; it is trapped in a waiting pattern, where the next directional clue will come from whether volume expands alongside a clean break of resistance or a failure at support.
Technical Verdict: HOLD (wait & see)
HOLD (wait & see)
- SMA20 and SMA50 both sit below price, which keeps the structure constructive, but the sideways trend and lack of a new MA cross show there is no fresh trend confirmation.
- MACD is slightly positive and the histogram is above zero, but RSI 52.0 and Stochastic 49.0/51.0 remain neutral, so momentum is improving without being decisive.
- Volume is only 0.5x average and OBV is down, which weakens the case for a breakout because price is not being backed by broad participation.
- Verdict invalidated if price breaks below 4.25, because that would put the short-term support and the current range structure under pressure.
- Ideal entry range: 4.25 to 4.42
- Exit target: 4.61
- Stop loss protection: below 4.25, with the next downside reference at 4.15
For non-traders, this means Singtel is neither breaking out nor breaking down, and the chart is asking for confirmation before it chooses a direction.
Latest hard fact: the 20-hour resistance stands at 4.61 SGD.
Summary Data Singtel
| Last price | 4.43 SGD |
| Change 1 day / 5 days / 1 month | -0.67% / 2.78% / 0.68% |
| Trend / MA-cross | sideways / none |
| SMA20 / SMA50 | 4.42 / 4.39 |
| RSI (14) / Stochastic %K | 52.0 / 49.0 |
| Bollinger %B / ATR | 54% / 0.10 |
| Support / Resistance 20 days | 4.25 / 4.61 |
| Data as of | 18 Agustus 2026 08:00 WIB |
Track Singtel share price daily: live levels, support/resistance and our full Singtel analysis history.