Tencent Stock Analysis: Gains 0.18%, Momentum Weakens
On Agustus 20, 2026: price 447.20 HKD, trend sideways, RSI 42.0, support 434.60, resistance 492.20. technical analysis of tencent stock.

Tencent Holdings’ shares on HKEX slipped to HKD 447.20 in Tuesday trade, staying below both the SMA20 at 461.79 and the SMA50 at 454.85, a setup that shows the stock is still trading under its short- and medium-term trend lines even after a small 0.18% daily gain. The broader message from the tape is not strength, but stabilization after weakness: the stock is still down 5.01% over five days and 5.65% over one month, while the trend remains sideways and the SMA20 is sloping down 1.49% over five days. That combination usually means sellers have not fully lost control, but the pace of decline has cooled enough to keep the market in a waiting pattern rather than a clean breakdown.
Trend & Price Action
As shown in the chart, Tencent is sitting in the lower half of its recent range, with price at about 22% of the 20-hour range between support at 434.60 and resistance at 492.20. The stock is also below the middle Bollinger band, which sits at 461.79, reinforcing that the market is still trading beneath its recent average. In practical terms, that matters because a stock below the midpoint of its volatility band is usually still trying to prove it can reclaim momentum, rather than already being in a sustained advance.
The absence of a fresh MA-cross is important too. A moving-average crossover is often read as a trend signal, and the lack of one here means the chart has not delivered a decisive new directional cue. Instead, Tencent is drifting under both averages, with the SMA20 and SMA50 both acting as overhead reference points.
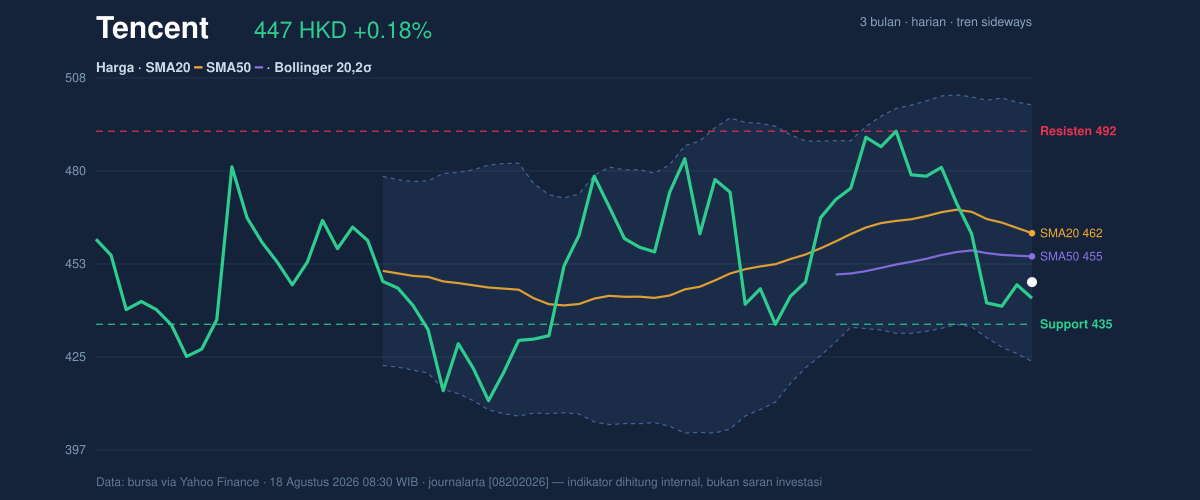
The immediate visual is one of compression after a slide, not a breakout.
Oscillators & Momentum
The momentum picture is mixed, and that mix is the story. The RSI at 42.0 is neutral, which means Tencent is not yet in an oversold panic or an overbought stretch; it is simply weak enough to reflect cautious sentiment. By contrast, the Stochastic %K at 10.4 and %D at 11.2 are both in oversold territory, suggesting short-term selling has become stretched. That does not guarantee a rebound, but it does tell readers that downside momentum is getting tired on a very short horizon.
The problem is that the broader trend indicators are not confirming a turn. The MACD at -2.238, with the signal line at 2.529 and a histogram of -4.767, shows momentum is still negative and still meaningfully below the signal line. In plain English: short-term price action may be close to washed out, but the underlying trend engine is still pointing down.
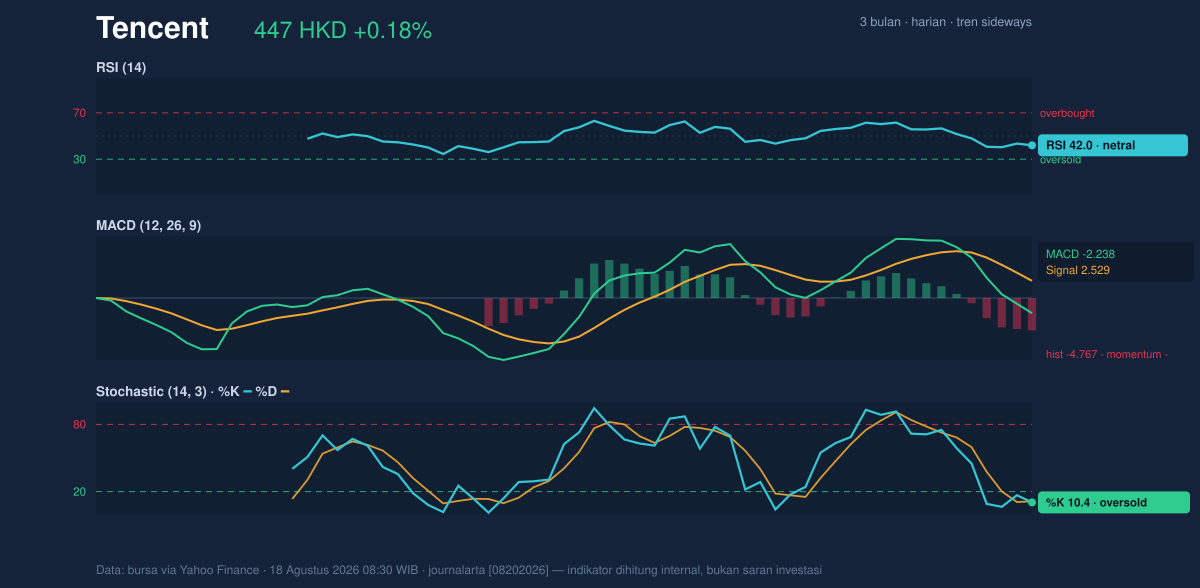
That split between oversold stochastics and negative MACD is the kind of setup that often leads to choppy trading, not instant recovery.
Volatility & Volume
Volatility is present, but not extreme. The ATR(14) of 13.04, equal to 2.9% of price, suggests movement is active enough to matter without looking disorderly. Bollinger Bands also point to a market that is not in a squeeze: the band width is 16.6%, described as normal. That matters because a squeeze often precedes a sharp move; here, there is no strong compression signal forcing an imminent expansion. The %B at 31% shows the share price is closer to the lower band at 423.53 than the upper band at 500.05, which is consistent with a weak but not capitulative tone.
Volume is less encouraging. Last volume of 23,218,078 was only 0.8× the 20-hour average of 28,698,134, and OBV is falling. That combination says the recent move lower has not been met with strong accumulation. In other words, buyers have not yet shown enough conviction to reverse the tape, and the lack of heavier participation weakens any early bounce attempt.
Key Levels & Scenarios
The chart’s most important reference points are clear. Support at 434.60 is the first level to watch, while 423.53 marks the lower Bollinger band and 411.00 is the 3-month low. On the upside, 454.85 (SMA50) is the first hurdle, followed by 461.79 (SMA20 and Bollinger midline) and then 492.20 resistance.
If Tencent holds above 434.60, the oversold stochastic reading leaves room for a technical bounce toward the 454.85 to 461.79 area, where the stock would need to prove it can reclaim its averages. If 434.60 fails, the chart opens a path toward 423.53 and then the 411.00 three-month low, which would confirm that the recent weakness is not just a pause but a deeper leg lower.
The key point is that the stock is not broken, but it is still under pressure.
Technical Verdict: HOLD (wait & see)
HOLD (wait & see) is the most defensible reading because the chart shows a weak trend, but not one that has yet triggered a clean breakdown. The strongest reasons are: price remains below SMA20 and SMA50, MACD is negative with a wide negative histogram, and volume is below average with OBV declining, which means the market has not yet confirmed a durable reversal. The oversold Stochastic reading argues for caution on the downside, but it is not enough on its own to override the broader weakness.
- Ideal Entry Range: 434.60 to 423.53
- Exit Target: 454.85 to 461.79
- Stop Loss protection: below 411.00
This verdict is invalidated if price falls below 411.00, because that would break the three-month low and turn a weak range into a more serious downtrend.
For non-traders, that means Tencent is still trying to find its footing, and the chart has not yet shown enough proof that the pressure has ended.
“Until the stock can reclaim its averages, the burden of proof stays with the bulls.”
Summary Data Tencent
| Last price | 447.20 HKD |
| Change 1 day / 5 days / 1 month | 0.18% / -5.01% / -5.65% |
| Trend / MA-cross | sideways / none |
| SMA20 / SMA50 | 461.79 / 454.85 |
| RSI (14) / Stochastic %K | 42.0 / 10.4 |
| Bollinger %B / ATR | 31% / 13.04 |
| Support / Resistance 20 days | 434.60 / 492.20 |
| Data as of | 18 Agustus 2026 08:30 WIB |
Track Tencent share price daily: live levels, support/resistance and our full Tencent analysis history.