Testing Key Resistance, DBS Stock Drops 1.14% Today
On Agustus 20, 2026: price 76.00 SGD, trend uptrend, RSI 59.9, support 72.00, resistance 76.99. technical analysis of dbs stock. Testing Key Resistance — full…

DBS Group’s shares slipped to SGD 76.00 on 18 August 2026, down 1.14% from the previous close of SGD 76.88, even though the broader structure still points to an uptrend. That pullback matters less for the size of the drop than for where it happened: the stock is still holding above its SMA20 at SGD 74.83 and well above its SMA50 at SGD 70.20, which tells investors the medium-term trend remains intact even as short-term momentum cools.
The signal mix is therefore mixed, not broken. Price is sitting in the upper part of its recent range, with the stock around 80% of the 20-day range and just below resistance at SGD 76.99, while the 3-month high at SGD 77.97 remains within reach. That positioning is important: it shows DBS is still trading near the top of its recent band, but it has not yet proven it can push through the ceiling. As shown in the chart, the market is coiling rather than trending hard in one direction.
Trend & Price Action
The longer-term picture remains constructive because the share price is above both key moving averages and the SMA20 is rising by 1.29% over 5 days. In plain language, that means the short-term trend is still pointing upward even after a modest pullback. A rising SMA20 often acts like a moving floor for price, and DBS is still above it. The absence of a fresh MA-cross is also notable: there is no new signal of trend reversal from the moving averages, so the current structure is more of a pause than a breakdown.
The Bollinger Bands reinforce that interpretation. Price is near the upper half of the band structure, with the upper band at SGD 77.36, the middle at SGD 74.83, and the lower at SGD 72.31. The 6.7% band width is relatively tight and described as a squeeze, which usually means the market is compressing energy for a larger move. That move can go either way, but in the context of a rising trend and price above the mid-band, the market is still leaning upward unless support gives way.
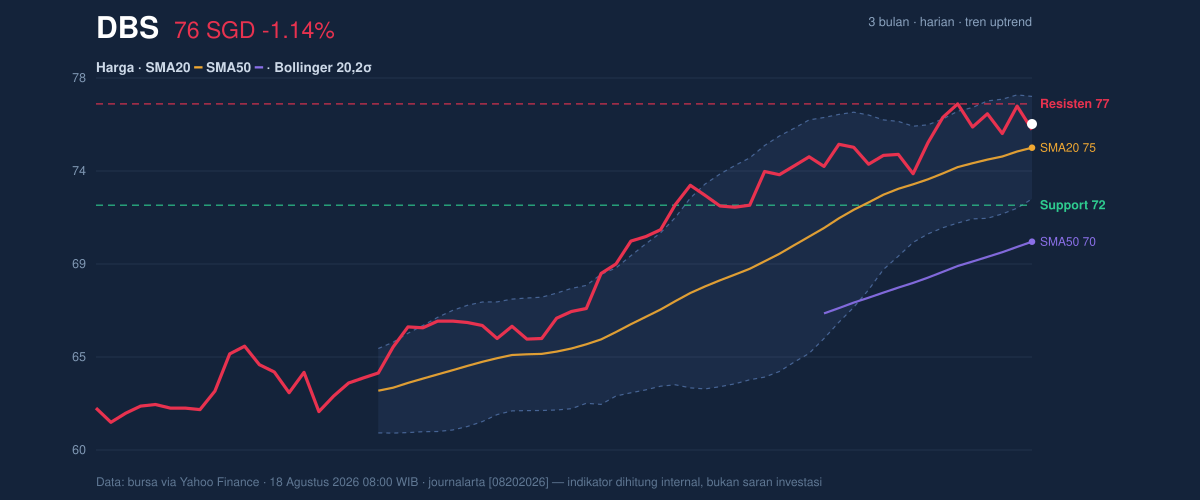
A short step back, but not a trend break.
Oscillators & Momentum
The momentum gauges are less enthusiastic than the trend. The RSI at 59.9 is neutral, which means DBS is neither overbought nor oversold. That matters because it suggests there is still room for price to rise without immediately hitting an exhaustion signal. The Stochastic %K at 51.2 and %D at 58.9 are also neutral, showing no strong short-term overextension.
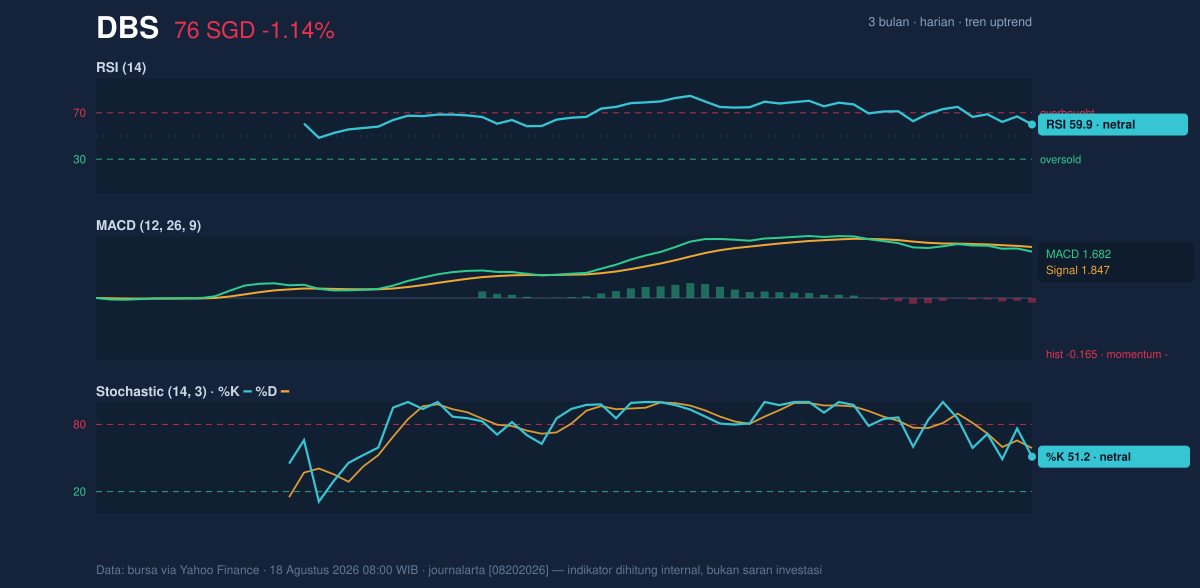
The more cautionary signal comes from MACD. The MACD at 1.682 is still positive, but it sits below the signal line at 1.847, leaving a histogram of -0.165. That negative histogram means upside momentum has weakened in the near term, even though the broader trend has not turned down. In practical terms, DBS is not flashing a bearish reversal, but it is also not accelerating higher. The market is advancing more by structure than by force.
Volatility & Volume
Volatility is moderate, not extreme. The ATR(14) at 1.35, equal to 1.8% of price, indicates a typical daily swing that is meaningful but not disruptive. Combined with the Bollinger squeeze, this suggests a quieter phase that could precede a sharper move once the price escapes the current band.
Volume adds an important wrinkle. The latest turnover of 3,225,600 shares was only 0.7× normal versus the 20-hour average of 4,896,820. That means the latest dip did not come with heavy selling pressure. In markets, a fall on weak volume often carries less conviction than a fall on strong volume. The OBV is rising, which supports the idea that underlying accumulation has not vanished even as the stock paused. The message from volume is simple: sellers have not taken command.
Key Levels & Scenarios
The immediate battleground is tight. Support at SGD 72.00 is the lower reference point from the 20-hour range, while resistance at SGD 76.99 is the near-term cap. Price is currently above the middle Bollinger band and close to the top of the recent range, so the next move matters more than the last one.
If DBS can reclaim and hold above SGD 76.99, the chart would start to challenge the 3-month high at SGD 77.97, with the upper Bollinger band at SGD 77.36 acting as an intermediate checkpoint. If it fails to hold the current zone and slips toward SGD 72.00, that would suggest the squeeze is resolving lower and the market is rotating back toward the middle of the trend structure at SGD 74.83 or below.
Technical Verdict: HOLD (wait & see)
HOLD (wait & see)
- Trend is still positive: price remains above SMA20 at SGD 74.83 and SMA50 at SGD 70.20, so the broader structure has not rolled over.
- Momentum is cooling: MACD is below its signal line with a -0.165 histogram, which argues against treating the current move as a fresh breakout.
- Volume is not confirming weakness: turnover is only 0.7× normal while OBV is rising, so the pullback lacks strong bearish participation.
- Verdict invalidated if price falls below SGD 72.00, because that would break the nearest support and weaken the rising structure.
- Ideal entry range: SGD 74.83 to SGD 76.00
- Exit target: SGD 76.99 to SGD 77.97
- Stop loss protection: below SGD 72.00
For non-traders, this means DBS still looks structurally healthy, but the chart is waiting for proof that the next move is upward rather than just a pause.
“The market is coiling rather than trending hard in one direction.”
Summary Data DBS
| Last price | 76.00 SGD |
| Change 1 day / 5 days / 1 month | -1.14% / -1.29% / 5.70% |
| Trend / MA-cross | uptrend / none |
| SMA20 / SMA50 | 74.83 / 70.20 |
| RSI (14) / Stochastic %K | 59.9 / 51.2 |
| Bollinger %B / ATR | 73% / 1.35 |
| Support / Resistance 20 days | 72.00 / 76.99 |
| Data as of | 18 Agustus 2026 08:00 WIB |
Track DBS share price daily: live levels, support/resistance and our full DBS analysis history.