TSLA Stock Gains 4.23% Today, Testing Key Resistance
On Agustus 20, 2026: price 351.12 USD, trend sideways, RSI 53.4, support 298.32, resistance 351.12. technical analysis of tsla stock. TSLA Stock Gains — full…

Tesla shares rose on Nasdaq, with TSLA last at $351.12 in New York trading on 19 August 2026, after a session that pushed the stock to the top of its 20-day Bollinger band and back above its short-term average. The move matters because it shows buyers have regained control in the very near term, even though the broader chart still looks more like a sideways consolidation than the start of a clean new uptrend.
Trend & Price Action
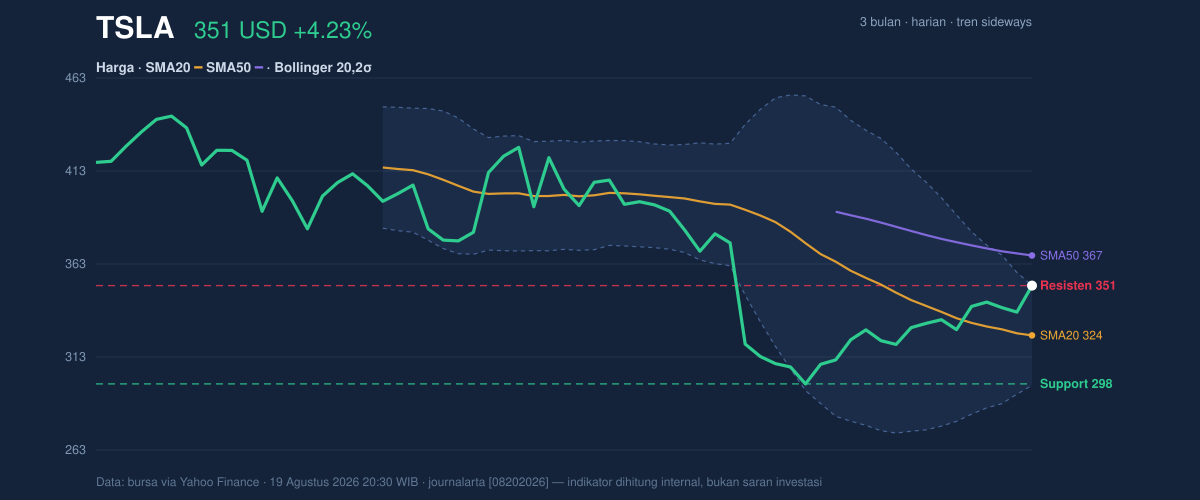
The stock’s latest advance came after a weak month, with TSLA down 6.12% over 1 month even as it gained 4.23% in 1 day and 7.21% over 5 days. That combination usually signals a rebound inside a broader pause, not a full trend reversal. The chart shows price above the SMA20 at $324.38, which is a constructive short-term signal because traders often read that as the market reclaiming its recent average. But the stock remains below the SMA50 at $367.26, so the medium-term structure has not yet fully turned positive.
The absence of a new MA-cross also matters. A moving-average crossover is often used as a trend confirmation tool; without one, the recent bounce is still more of a test than a declaration. The slope of the SMA20 at -2.77% over 5 days suggests the short-term trend had been leaning lower before this rebound, which is why the current move should be treated as early evidence rather than proof. As shown in the chart, the stock is also sitting at the upper edge of its recent range, with 20-hour resistance at $351.12 matching the latest print.
Oscillators & Momentum
Momentum is mixed, and that is the key tension in the setup. The RSI(14) at 53.4 is neutral, which means the stock is neither stretched on the upside nor deeply washed out. In plain English, RSI is saying the rally has room, but not much margin for error. The more aggressive signal comes from stochastic, where %K at 99.0 and %D at 82.7 indicate an overbought condition. That does not automatically mean the stock must fall; rather, it tells readers the latest rise has been fast enough that near-term buyers may already be crowded in.
[GRAFIK-MOMENTUM]
The MACD picture is more supportive. With MACD at -7.039, the line is still below zero, which means the broader momentum has not fully flipped positive. But the signal line at -12.611 and histogram at 5.572 show momentum is improving, because the MACD line is moving ahead of its signal. That setup often appears during early recoveries: the stock is still repairing damage from the prior decline, but the pace of decline has eased enough to allow a bounce. The signal is constructive, though not yet decisive.
Volatility & Volume
Volatility is active but not extreme. The ATR(14) at 11.10, or 3.2% of price, indicates a normal trading environment rather than a panic move. That matters because a stock with moderate ATR can still swing meaningfully, but the day-to-day noise is not unusually wide. Bollinger Bands reinforce that reading: the upper band at $351.23 is almost identical to the latest price, while the middle band at $324.38 sits below. With %B at 100%, TSLA is effectively pressing the top of its recent volatility envelope. In practical terms, that often means the stock has reached a short-term ceiling unless fresh buying appears.
Volume was not especially convincing. The latest 36,613,200 shares traded were about 0.9× normal versus the 20-hour average of 39,499,345. That suggests the move was not driven by a dramatic surge in participation. Still, OBV is rising, which is important because on-balance volume tracks whether money is generally flowing into the stock over time. Rising OBV alongside a price rebound usually supports the idea that accumulation is happening under the surface, even if the latest session did not come with heavy turnover.
Key Levels & Scenarios
The chart’s most immediate reference point is the $351.12 resistance, which is also the latest price. Because the stock is at the 100% end of its 20-hour range, it is testing the upper boundary rather than comfortably moving through it. Below that, the SMA20 at $324.38 is the first meaningful support zone, because it sits at the middle Bollinger band and marks the area where the latest rebound would begin to lose credibility if revisited. A deeper floor is the 3-month low at $297.38, with nearby support at $298.32, a level that would matter if the current bounce fails and sellers regain control.
The 3-month high at $445.60 remains far above current trading, which highlights how much of the prior advance has already been given back. That distance also explains why the current bounce is technically important but not yet transformative: TSLA is still rebuilding structure inside a wide range.
Technical Verdict: HOLD (wait & see)
HOLD (wait & see)
- RSI is neutral at 53.4, so momentum is not stretched enough to justify a strong directional call.
- MACD histogram is positive at 5.572, which supports the rebound, but MACD remains below zero at -7.039, so the broader trend is not fully repaired.
- %B at 100% and stochastic at 99.0/82.7 show the stock is pressing the top of its Bollinger band and may be vulnerable to cooling off.
Verdict invalidated if price breaks below $298.32.
- Ideal Entry Range: $324.38 to $351.12
- Exit Target: $367.26
- Stop Loss protection: below $298.32
For non-traders, this means the stock is improving, but it is still trading at a point where strength can fade quickly unless the move gets follow-through. The next scheduled reference point for the chart is whether TSLA can hold above $351.12 or slip back toward $324.38.
Summary Data TSLA
| Last price | 351.12 USD |
| Change 1 day / 5 days / 1 month | 4.23% / 7.21% / -6.12% |
| Trend / MA-cross | sideways / none |
| SMA20 / SMA50 | 324.38 / 367.26 |
| RSI (14) / Stochastic %K | 53.4 / 99.0 |
| Bollinger %B / ATR | 100% / 11.10 |
| Support / Resistance 20 days | 298.32 / 351.12 |
| Data as of | 19 Agustus 2026 20:30 WIB |
Track TSLA stock price daily: live levels, support/resistance and our full TSLA analysis history.