UOB Stock Analysis: Drops 1.39%, Testing Support Level
On Agustus 20, 2026: price 40.56 SGD, trend sideways, RSI 36.4, support 40.88, resistance 43.89. technical analysis of uob stock. UOB Stock Analysis — full…

United Overseas Bank slipped on the Singapore Exchange, with U11.SI last changing hands at 40.56 SGD, down from a previous close of 41.13, as the share price stayed under pressure below its short- and medium-term trend lines. The move matters because it is not just a one-day dip: the stock is now trading beneath SMA20 at 42.79 and SMA50 at 41.57, which tells readers that recent price action has been weaker than both the last month’s and the last few months’ average. In plain language, the market is still treating rallies as something to fade rather than a sign of renewed strength.
Trend & Price Action
As shown in the chart, the stock remains in a sideways trend, but the tone of that range has turned softer because the SMA20 is sloping down by 1.21% over 5 days. That slope is important: a flat range can be healthy consolidation, but a downward-tilting average usually means sellers are using strength to reduce exposure. The share price is also sitting below the 20-day Bollinger middle band at 42.79 and under the 20-day support at 40.88 by a small margin, which suggests the market is probing the lower edge of the recent range rather than building a base in the middle of it.
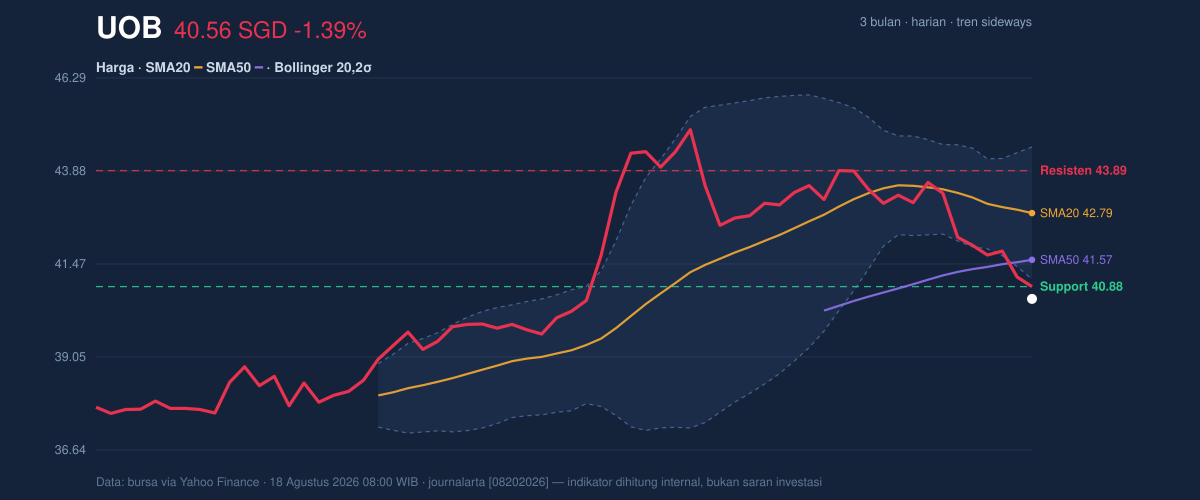
The broader map remains defined by the 3-month high at 45.15 and the 3-month low at 37.41. UOB is not near panic territory, but it is closer to the lower half of that range than the upper half, and that positioning usually signals caution. The stock is also 11% below the 20-day range midpoint, which tells us it has lost momentum inside its own trading band. In technical terms, that often means any rebound first has to prove it can reclaim the middle of the range before traders start trusting the move.
Oscillators & Momentum
Momentum indicators are mixed, but the balance is still negative. The RSI at 36.4 sits in neutral territory, yet it is close enough to the oversold zone to show that selling pressure has been persistent without reaching a full washout. That matters because a neutral RSI in a falling price sequence often means the stock is weak, but not yet decisively oversold enough to force a sharp rebound.
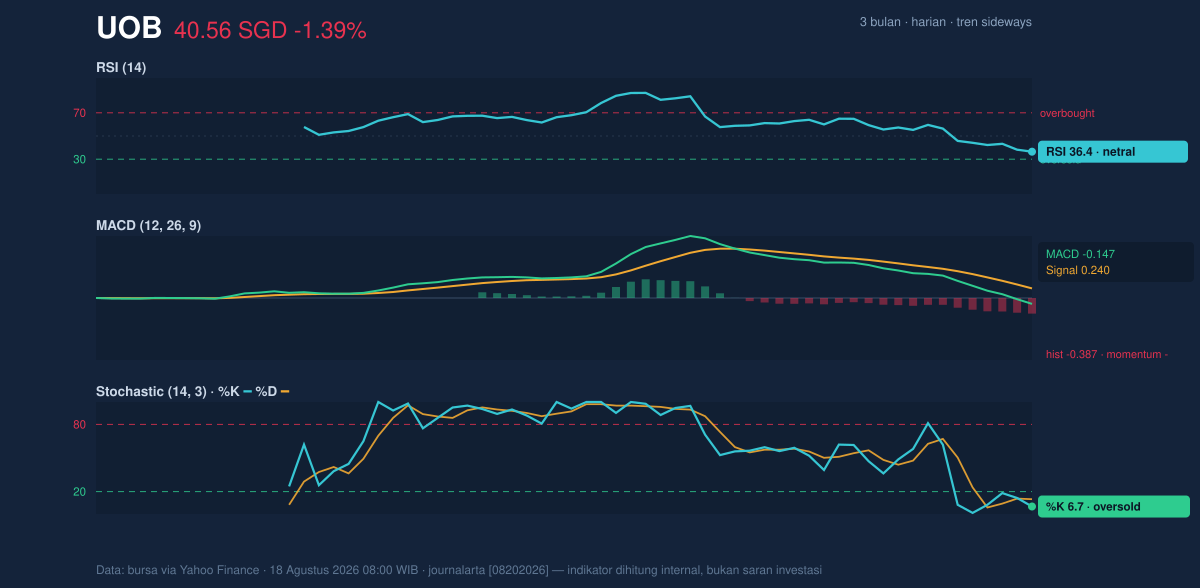
The more immediate short-term signal comes from the Stochastic oscillator, with %K at 6.7 and %D at 13.2. That is an oversold reading, which means the stock has been closing near the low end of its recent range for several sessions. Oversold does not automatically mean recovery, but it does tell readers that downside momentum may be stretched in the near term. The problem is that the MACD is still negative at -0.147, with the signal line at 0.240 and the histogram at -0.387. In practical terms, MACD is saying the trend’s internal momentum has not turned up yet; the stock may be oversold, but it has not shown convincing evidence of a reversal.
Volatility & Volume
Volatility is present, but not extreme. The ATR(14) at 0.76, equal to 1.9% of price, points to moderate volatility, meaning daily swings are meaningful but not disorderly. That is useful because it suggests any break of nearby support or resistance could travel with follow-through, rather than being immediately smothered by noise.
Bollinger Bands add another layer to the story. The band width of 8.0% is normal, so this is not a squeeze that typically precedes a sharp expansion. Yet the %B at -15% is a notable signal: it places the price below the lower band, which often reflects short-term selling pressure that has gone a bit too far relative to recent volatility. The signal is not a bullish reversal by itself, but it does show the stock is trading at the weak edge of its recent statistical range.
Volume has not confirmed a strong rebound attempt. Last traded volume was 2,551,000, well below the 20-day average of 3,666,328, or about 0.7x normal. That matters because weak volume on a down move can sometimes mean selling is not especially forceful, but it also means there is not yet enough participation to validate a recovery. The OBV is falling, which indicates that volume flow has been leaning toward distribution rather than accumulation. In simple terms, more shares have been changing hands on weaker days than on stronger ones.
Key Levels & Scenarios
The nearest level to watch is the 20-day support at 40.88. Since the stock is already trading below it, that area has shifted from support to a checkpoint for whether buyers can quickly reclaim lost ground. Above that, the first meaningful ceiling is 20-day resistance at 43.89. A move back through that zone would tell readers the market is starting to repair the damage and move back toward the center of the range.
If the share price fails to recover 40.88, the next area of interest is the lower part of the 3-month range near 37.41. If it reclaims 41.57 and then 42.79, the chart would begin to look less fragile, because the price would be back above both moving averages and the Bollinger midpoint. The signal to watch is not just whether the stock rises, but whether it can do so with improving momentum and better volume than the latest session.
Technical Verdict: HOLD (wait & see)
HOLD (wait & see)
- RSI at 36.4 and Stochastic at 6.7/13.2 show the stock is weak and oversold in the short term, but not yet clearly reversing.
- MACD at -0.147 with a negative histogram confirms downside momentum is still dominant.
- Price below SMA20 at 42.79 and SMA50 at 41.57, plus OBV falling, means the market has not yet shown convincing accumulation.
- Verdict invalidated if price falls below 37.41 on a sustained basis, because that would break the 3-month floor and signal a deeper range breakdown.
- Ideal Entry Range: 40.88 to 41.57
- Exit Target: 42.79 to 43.89
- Stop Loss protection: below 37.41
For non-traders, this means the stock looks stretched on the downside, but the chart has not yet proved that sellers are finished.
Summary Data UOB
| Last price | 40.56 SGD |
| Change 1 day / 5 days / 1 month | -1.39% / -3.80% / -4.92% |
| Trend / MA-cross | sideways / none |
| SMA20 / SMA50 | 42.79 / 41.57 |
| RSI (14) / Stochastic %K | 36.4 / 6.7 |
| Bollinger %B / ATR | -15% / 0.76 |
| Support / Resistance 20 days | 40.88 / 43.89 |
| Data as of | 18 Agustus 2026 08:00 WIB |
Track UOB share price daily: live levels, support/resistance and our full UOB analysis history.