RSI Overbought, MRK Stock Gains 3.84% Today
On Agustus 26, 2026: price 156.45 USD, trend uptrend, RSI 77.6, support 127.77, resistance 156.45. technical analysis of mrk stock. RSI Overbought — full…
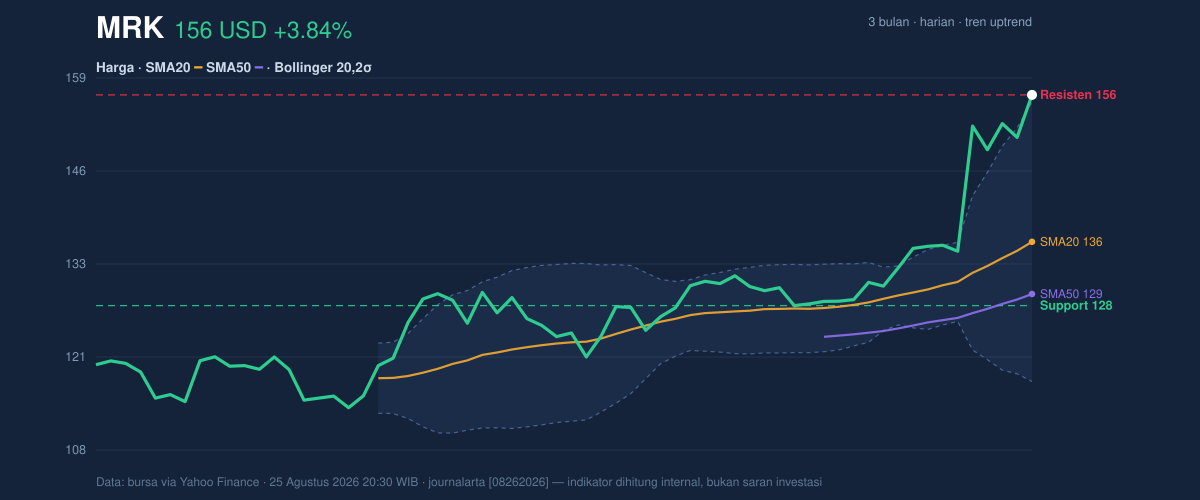
Merck is pressing against the top of its recent trading range, with the stock closing at 156.45 USD after a 3.84% daily gain, while momentum remains strong enough to keep the rally intact even as short-term signals warn that the move is getting stretched. For international readers, the key issue is not just that the share price is rising, but that it is rising into a zone where traders often start testing whether the move has already priced in the good news.
Merck’s latest move comes with a clear technical backdrop: the shares are trading well above both the SMA20 at 136.45 and the SMA50 at 129.34, which tells investors the stock is not merely bouncing but is operating in an established uptrend. The SMA20 slope of 4.17% over 5 days shows that the short-term trend is still accelerating, and the fact that there is no fresh MA-cross means the current advance is being carried by price strength rather than a new moving-average crossover signal. In plain terms, the trend is already in motion; the question now is whether it can keep stretching without pausing.
The chart also shows that Merck is sitting at the very top of its near-term range, with support at 127.77 and resistance at 156.45, while the 3-month high is 156.92. That matters because a stock that is trading at the edge of its range has less room for easy upside and more room for profit-taking. The last price is 100% of the 20-hour range, which signals that the market has fully pushed into the upper boundary rather than building a base below it.
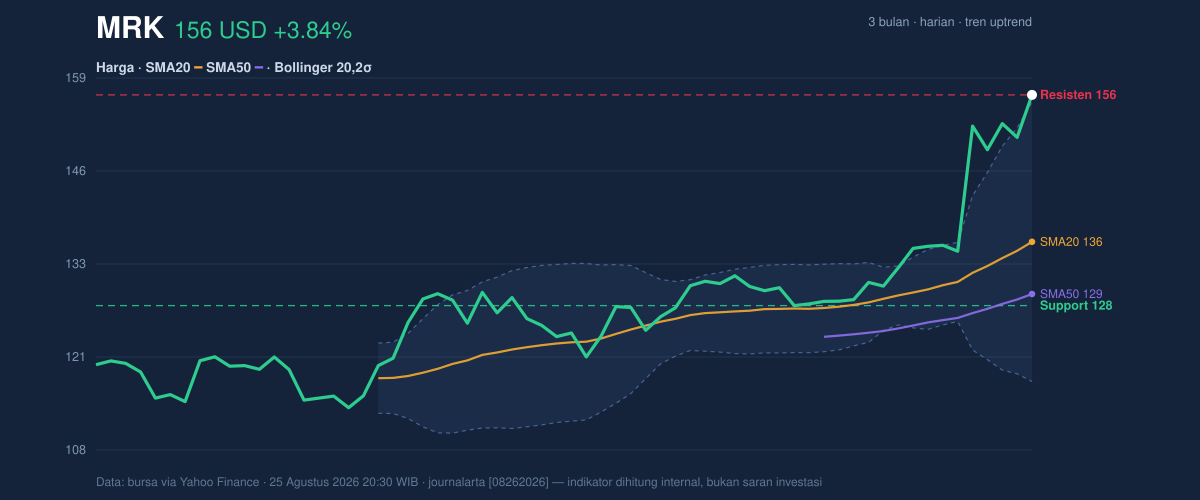
The Bollinger Bands sharpen that reading. Merck is trading above the upper band at 155.47, with %B at 103%, meaning price is not just near the top of the band but beyond it. That usually signals strong momentum, but it also often marks an overextended condition where the stock is vulnerable to a pullback or consolidation. The 27.9% band width shows the bands are expanding, a sign that volatility is rising and the market is allowing for larger price swings. In other words, the trend has energy, but it is also becoming less forgiving.
Volume confirms that the move has participation behind it. Last trade volume of 13,990,300 was about 1.3× normal versus the 20-day average, and OBV is rising, which indicates that money flow has been supporting the advance rather than quietly fading. That is important because breakouts and trend extensions are more credible when volume expands with price, not when price climbs on thin trading. Still, rising volume does not erase the fact that the stock is already extended.
Short sentence: momentum is real, but so is the stretch.
Oscillators & Momentum
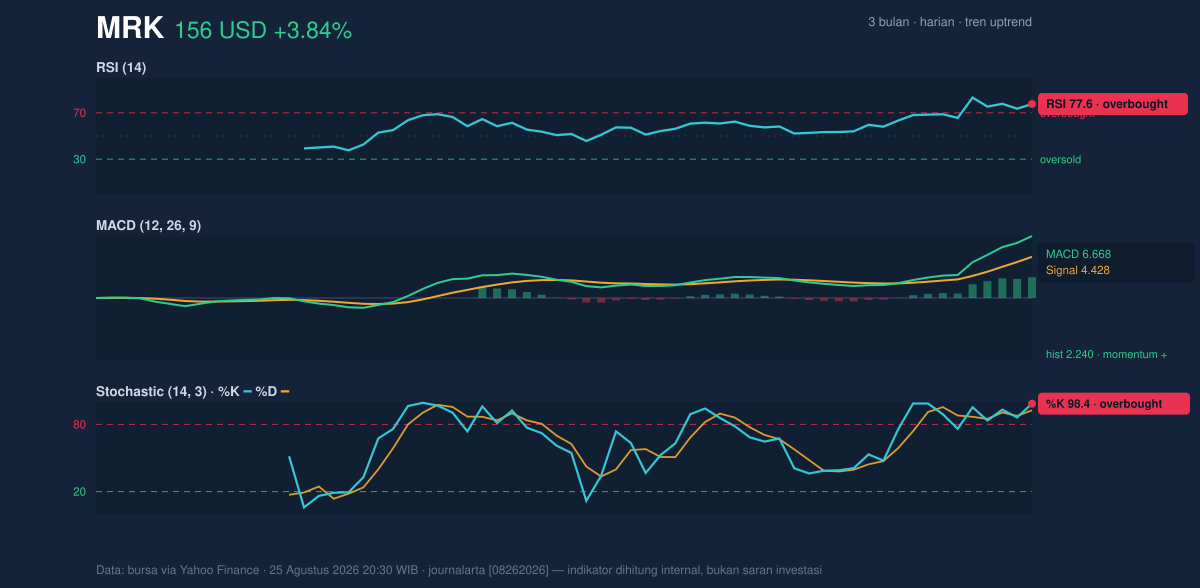
The oscillator set is where the caution flag appears. Merck’s RSI(14) is 77.6, which is firmly in overbought territory, and the Stochastic %K at 98.4 and %D at 92.6 are also overbought. For general readers, overbought does not mean the stock must fall immediately; it means the recent pace has been unusually fast and the market may be vulnerable to a pause, even if the broader trend stays positive. That is especially relevant after a 1-month gain of 18.68% and a 5-day jump of 15.74%.
At the same time, the MACD at 6.668 remains above the signal line at 4.428, with a positive histogram of 2.240. This is the clearest confirmation that the underlying trend is still bullish. MACD measures whether recent price momentum is stronger than the longer baseline; when the line stays above its signal and the histogram is positive, it usually means the trend still has buying pressure behind it. So the message from momentum is mixed but not contradictory: the trend is strong, yet the move is mature enough to deserve caution.
Volatility & Volume
The ATR(14) of 4.67, equal to about 3.0% of price, suggests day-to-day movement is still meaningful but not extreme relative to the current level. Combined with the expanding Bollinger Bands, that points to a market that is active and capable of sharp swings in either direction. The practical signal is that Merck may continue moving quickly, but traders should expect less smoothness than earlier in the trend.
This is where the chart’s support and resistance structure matters most. With the stock already at resistance 156.45 and just below the 3-month high of 156.92, a clean push through that zone would show the market is willing to accept a new higher trading area. If it fails to hold above that band, the first place the market is likely to look for balance is back toward the upper moving-average region around the SMA20 at 136.45. That gap is wide, which underscores how much of the recent move has already been digested by the market.
Technical Verdict: HOLD (wait & see)
HOLD (wait & see) — the trend is constructive, but the stock is also overbought and trading at the top of its range.
- Reason 1: MACD remains positive at 6.668 versus 4.428, which supports the ongoing uptrend.
- Reason 2: Price is above SMA20 and SMA50, confirming the broader trend is still upward.
- Reason 3: RSI 77.6 and Stochastic 98.4/92.6 are overbought, warning that the rally may need to cool before extending further.
- Verdict invalidated if price falls below 127.77, the 20-hour support area that would signal the recent breakout has lost its footing.
- Ideal Entry Range: 136.45 to 127.77, where the stock would be closer to the SMA20 and support zone.
- Exit Target: 156.92, the 3-month high and next clear resistance reference.
- Stop Loss protection: 127.77, the nearest support level from the DATA block.
For non-traders, this means the stock still looks strong, but it is already priced like a stock that has been running hard, so the next move matters more than the last one.
Merck’s next visible test is whether it can stay above 156.45 and press through the 156.92 3-month high on continued volume.
Summary Data MRK
| Last price | 156.45 USD |
| Change 1 day / 5 days / 1 month | 3.84% / 15.74% / 18.68% |
| Trend / MA-cross | uptrend / none |
| SMA20 / SMA50 | 136.45 / 129.34 |
| RSI (14) / Stochastic %K | 77.6 / 98.4 |
| Bollinger %B / ATR | 103% / 4.67 |
| Support / Resistance 20 days | 127.77 / 156.45 |
| Data as of | 25 Agustus 2026 20:30 WIB |
Track MRK stock price daily: live levels, support/resistance and our full MRK analysis history.



