AIA Momentum Gains: Stock Drops 0.54% (Agustus 27, 2026)
On Agustus 27, 2026: price 74.20 HKD, trend sideways, RSI 48.5, support 70.40, resistance 79.65. technical analysis of aia stock. AIA Momentum Gains — full…
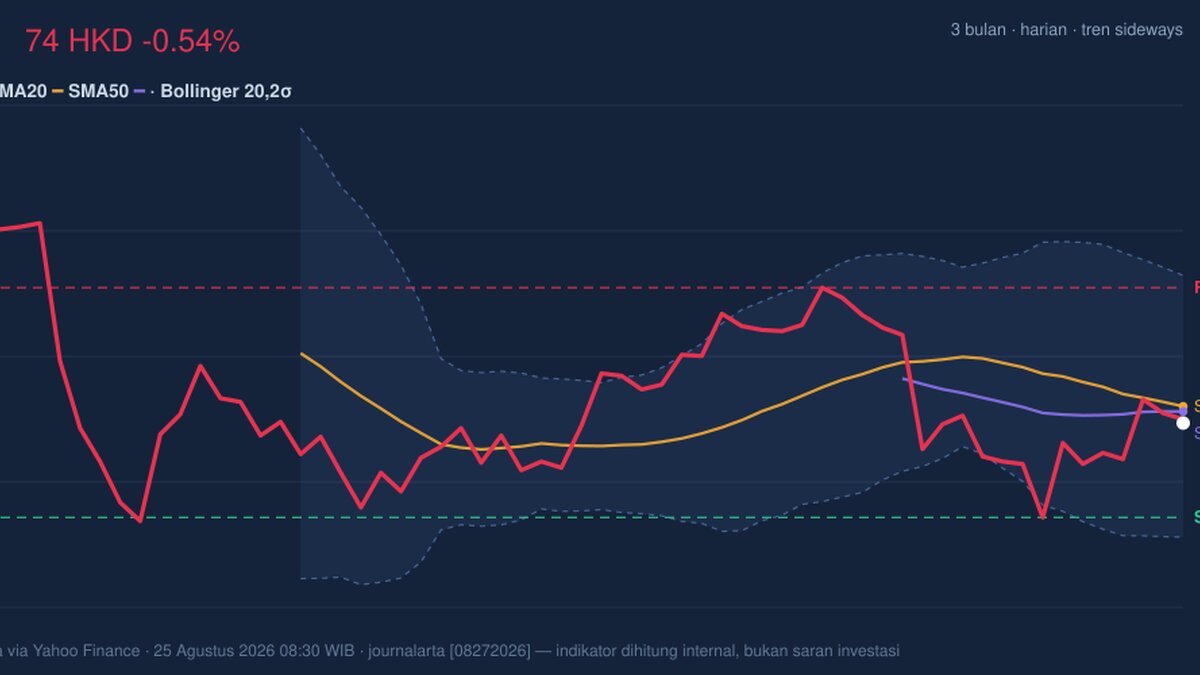
74.20 HKD on the Hong Kong exchange left AIA Group below its 20-day average and still pinned inside a sideways range, with the latest tape showing a mild daily decline of 0.54% even after a 2.27% gain over five days. The price action matters more than the headline move: it says the stock is not in a clean trend, but in a balancing act between recent selling pressure and a short-term attempt to stabilize.
Trend & Price Action
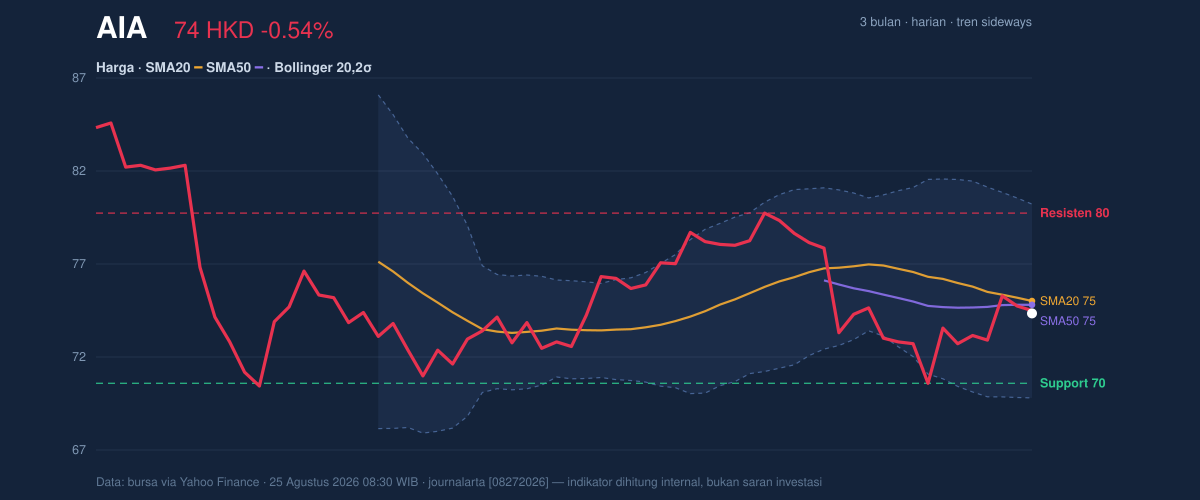
As shown in the chart, AIA is trading at 74.20 HKD, below the SMA20 at 74.87 and just under the SMA50 at 74.66. That positioning is important because it shows the shares are sitting slightly weak relative to the recent average, even though the longer average has not rolled decisively lower. In plain terms, the stock is drifting rather than breaking out.
The broader setup is sideways, and the SMA20 slope of -1.29% over 5 days suggests the short-term bias has softened. There is no fresh MA-cross, which means the moving averages are not giving a decisive trend signal. In technical terms, that often points to consolidation: buyers and sellers are still testing the same zone, without either side winning convincingly.
The price is also sitting at 41% of its 20-day range, between support at 70.40 and resistance at 79.65. That placement is closer to the lower half of the band, but not near the floor. The market is therefore telling a simple story: AIA has room to recover, but it has not yet proven that demand is strong enough to push through overhead supply.
Oscillators & Momentum
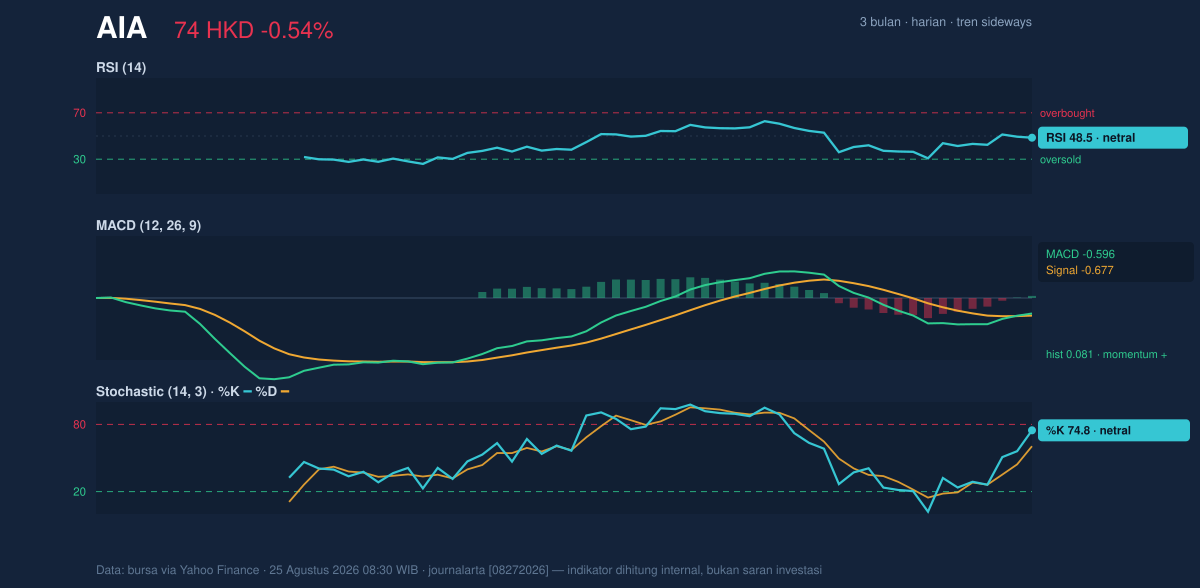
The momentum picture is mixed, and that is exactly what the chart is signaling. RSI at 48.5 is neutral, meaning the stock is neither stretched on the upside nor oversold enough to suggest a reflex bounce is already underway. Stochastic %K at 74.8 and %D at 60.5 also sit in neutral territory, but with %K above %D, short-term momentum has improved from earlier weakness. That is a constructive sign, though not a strong one.
The more interesting read comes from MACD at -0.596, with the signal line at -0.677 and a positive histogram of 0.081. That combination means downside momentum is still present on the main line, but the gap versus the signal line has turned favorable. In other words, the stock is not yet strong, but the momentum is no longer deteriorating as quickly. This is the kind of setup that can precede a base-building phase, provided price follows through.
Volatility & Volume
Bollinger Bands help frame where the stock sits within its recent volatility envelope. The upper band at 80.14, middle band at 74.87, and lower band at 69.61 show the share price near the center of the range, with %B at 44%. That reading means AIA is trading below the midline, but not close enough to the lower band to suggest panic selling. The 14.1% band width is normal, so there is no squeeze implying a sudden volatility breakout is imminent. Movement can still come, but the chart is not compressing hard enough to hint at an explosive move.
The ATR(14) of 2.41, equal to 3.2% of price, confirms moderate day-to-day movement. That matters because a stock in a sideways phase with moderate ATR can still make meaningful swings inside the range, but those moves need participation. Here, participation is weak: volume of 11,333,818 is only 0.3x the 20-day average of 32,530,249, and OBV is falling. OBV, or on-balance volume, tracks whether trading volume is supporting price. A declining OBV says the recent tape has not been backed by accumulation. That is a caution flag: the latest bounce attempt lacks conviction.
Key Levels & Scenarios
The chart’s most important boundaries remain 70.40 support and 79.65 resistance. Between those levels, AIA is trapped in a range that reflects indecision. If the stock can reclaim the 74.87 SMA20 and hold above it, the market would be signaling that short-term pressure is easing. If it can then challenge 79.65, the upper band at 80.14 becomes the next reference area, where sellers may reappear.
If, however, the price slips back toward 70.40, the lower Bollinger band at 69.61 becomes the key stress point. A break below that zone would suggest the range is failing and that the recent sideways pattern is resolving to the downside rather than resetting. The 3-month low at 69.05 sits just below that area, reinforcing how important the lower boundary is.
Technical Verdict: HOLD (wait & see)
HOLD (wait & see)
- RSI at 48.5 and Stochastic at 74.8/60.5 are neutral, so momentum is improving but not decisive.
- MACD histogram at 0.081 is positive, but price remains below SMA20 at 74.87, which limits confirmation.
- Volume at 0.3x average and falling OBV show weak participation, so the move lacks broad support.
Verdict invalidated if price breaks below 70.40.
- Ideal Entry Range: 74.20 to 74.87 HKD, where price sits near the middle band and the 20-day average.
- Exit Target: 79.65 to 80.14 HKD, aligned with resistance and the upper Bollinger band.
- Stop Loss protection: below 70.40 HKD, with the 69.61 lower band and 69.05 three-month low as the next warning zone.
For non-traders, this means AIA is not flashing a strong trend signal yet; it is still waiting for either a cleaner recovery above resistance or a break that shows the range has failed.
Summary Data AIA
| Last price | 74.20 HKD |
| Change 1 day / 5 days / 1 month | -0.54% / 2.27% / -4.75% |
| Trend / MA-cross | sideways / none |
| SMA20 / SMA50 | 74.87 / 74.66 |
| RSI (14) / Stochastic %K | 48.5 / 74.8 |
| Bollinger %B / ATR | 44% / 2.41 |
| Support / Resistance 20 days | 70.40 / 79.65 |
| Data as of | 25 Agustus 2026 08:30 WIB |
Track AIA share price daily: live levels, support/resistance and our full AIA analysis history.



