AstraZeneca Stock Gains 1.02% Today, Momentum Gains
On Agustus 27, 2026: price 12,234.00 GBp, trend sideways, RSI 54.0, support 11,460.00, resistance 13,134.00. technical analysis of astrazeneca stock.
AstraZeneca shares on the LSE rose to 12,234.00 GBp at 14:00 WIB on 25 August 2026, up 1.02% from the previous close of 12,110.00, according to Yahoo Finance data sourced from the exchange. The move matters less for its size than for where it happened: the stock is trading above its 20-day average but still below its 50-day average, a pattern that usually signals a market trying to stabilise after weakness rather than one that has fully reset into a clean uptrend.
Trend & Price Action
The chart shows AstraZeneca in a sideways trend, with the SMA20 at 12,027.10 and a -1.20% slope over five days. That slope is important. It says the short-term trend is still soft, even though the latest price has moved back above the 20-day line. In plain terms, the shares have recovered enough to reclaim near-term support, but not enough to prove that buyers have taken control of the broader direction.
The stock also sits below the SMA50 at 12,824.64, which keeps the medium-term picture cautious. A market above the short average but below the longer one often reflects a transition zone: sellers are no longer pressing as hard, but buyers have not yet forced a decisive breakout. There is no new MA-cross, so there is no fresh technical signal of trend reversal from the moving averages alone.
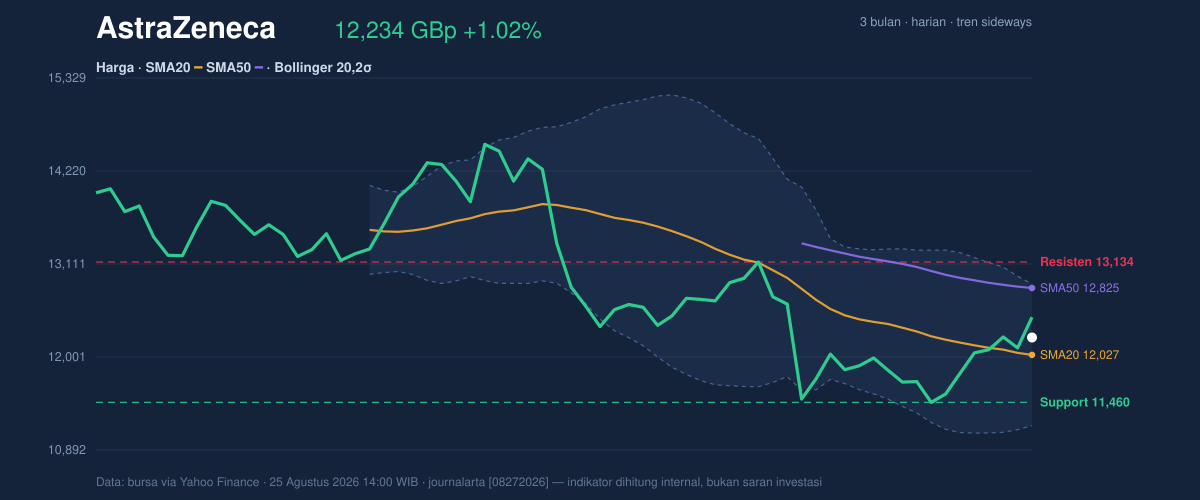
The current price is positioned at roughly 46% of the 20-day range, between 11,460.00 support and 13,134.00 resistance. That placement is telling. It suggests the shares are not stretched at the top of the recent band, but neither are they testing the base where value hunters usually become more active. The price is in the middle of the lane, where direction is often decided by the next volume-backed move.
Oscillators & Momentum
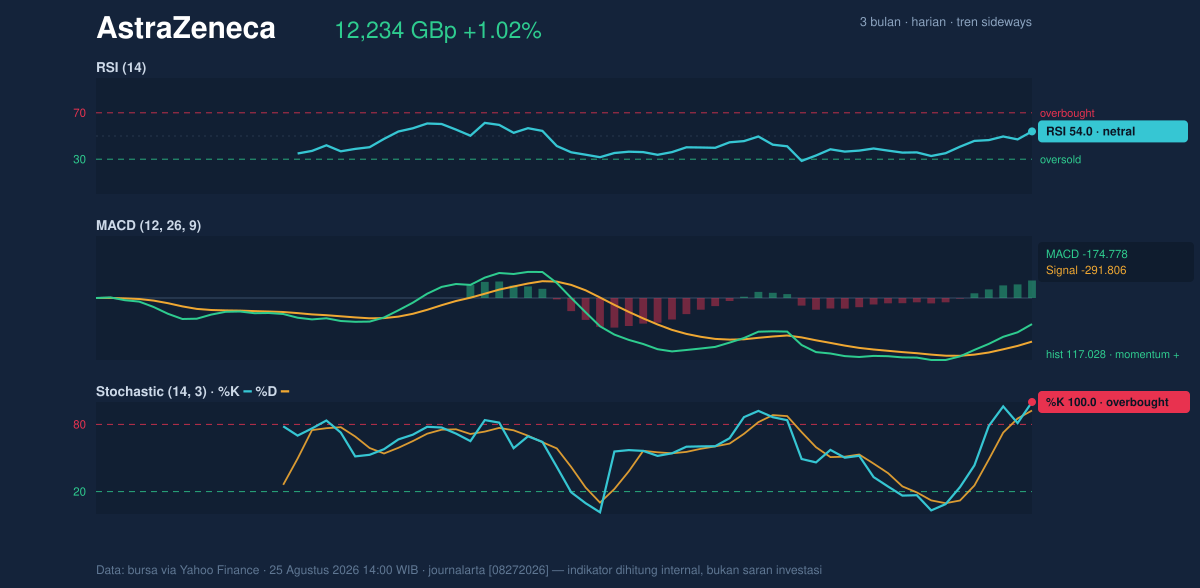
Momentum is mixed, and that mix is the key story. The RSI at 54.0 is neutral, which means the stock is neither overbought nor oversold on this measure. That is consistent with a market that has room to move either way. By itself, RSI is not warning of exhaustion.
The Stochastic %K at 100.0 and %D at 92.4 tell a different story. This oscillator is in overbought territory, which means the recent advance has been strong enough that short-term momentum may be running hot. In practical terms, the stock can stay overbought in a rising market, but the reading does raise the odds of a pause or pullback if buyers fail to extend the move quickly.
The MACD at -174.778 remains below zero, but the histogram at 117.028 is positive and the line is above its signal at -291.806. That combination is more constructive than the headline MACD number alone suggests. It shows momentum is improving from a weak base, even if the broader trend has not fully turned. The signal here is not “strong trend,” but “recovery phase.” That distinction matters.
Volatility & Volume
Bollinger Bands reinforce the same message. The price is trading inside a normal-width band structure, with the upper band at 12,871.99, the middle at 12,027.10, and the lower at 11,182.21. The %B at 62% means the shares are above the midline and leaning toward the upper half of the band, but not yet pressing the ceiling. The 14.0% band width is normal, so this is not a squeeze setup where a violent breakout is being compressed into a narrow range. Instead, the chart suggests orderly trading with room for expansion if volume arrives.
That volume piece is the caution flag. Last volume was 2,036,385, only 0.5x the 20-day average of 4,452,983. Thin participation weakens the credibility of any one-day rebound. The positive note is that OBV is rising, which indicates cumulative buying pressure has been building even while day-to-day turnover has been light. In other words, the stock is attracting some underlying accumulation, but not yet enough trading conviction to force a breakout on its own.
ATR adds another layer. At 270.65, or 2.2% of price, volatility is moderate. That means the shares can still move meaningfully, but the tape is not showing the kind of stress that typically comes with panic or a sharp trend break. The recent 3.63% gain over five days fits that profile: a decent rebound, but not a disorderly one.
Key Levels & Scenarios
The immediate technical map is fairly clear. 12,027.10 is the first line of support because it is the 20-day average and the Bollinger midline. If the stock slips back below that area, the recent recovery loses some credibility. Below that, 11,460.00 is the more important chart support from the 20-day range. A break there would suggest the rebound has failed and the stock is rotating back toward the lower band at 11,182.21.
On the upside, the first obstacle is 12,871.99, the upper Bollinger Band. Above that, 13,134.00 is the next resistance from the 20-day range. A clean move through that zone would matter because it would place the shares above the recent trading ceiling and closer to the 12,824.64 50-day average, where the market would begin to look less defensive.
The broader context is still useful. The stock remains well below the 3-month high of 15,126.00 and above the 3-month low of 9,892.00, which confirms that the long swing range is intact. The current price is not near either extreme, another sign that the market is still searching for direction rather than committing to a full trend.
Technical Verdict: HOLD (wait & see)
HOLD (wait & see) fits the current setup best because the chart is improving, but not decisively enough to call a trend reversal.
- RSI 54.0 is neutral, so there is no clear momentum edge.
- Stochastic 100.0 / 92.4 is overbought, which warns of near-term fatigue.
- MACD -174.778 with a positive histogram 117.028 shows recovery momentum, but the stock is still below SMA50 12,824.64.
Verdict invalidated if price breaks below 11,460.00.
- Ideal Entry Range: 12,027.10 to 12,234.00
- Exit Target: 12,871.99 to 13,134.00
- Stop Loss protection: below 11,460.00
For non-traders: the shares are improving, but the chart still needs confirmation before the move can be treated as durable.
AstraZeneca closed at 12,234.00 GBp on 25 August 2026, with volume at 2,036,385 versus a 20-day average of 4,452,983.
Summary Data AstraZeneca
| Last price | 12,234.00 GBp |
| Change 1 day / 5 days / 1 month | 1.02% / 3.63% / -5.46% |
| Trend / MA-cross | sideways / none |
| SMA20 / SMA50 | 12,027.10 / 12,824.64 |
| RSI (14) / Stochastic %K | 54.0 / 100.0 |
| Bollinger %B / ATR | 62% / 270.65 |
| Support / Resistance 20 days | 11,460.00 / 13,134.00 |
| Data as of | 25 Agustus 2026 14:00 WIB |
Track AstraZeneca share price daily: live levels, support/resistance and our full AstraZeneca analysis history.



