CSCO Stock Gains 1.13%, Momentum Weakens In Focus
On Agustus 27, 2026: price 112.36 USD, trend downtrend, RSI 45.7, support 109.59, resistance 123.88. technical analysis of csco stock. CSCO Stock Gains — full…
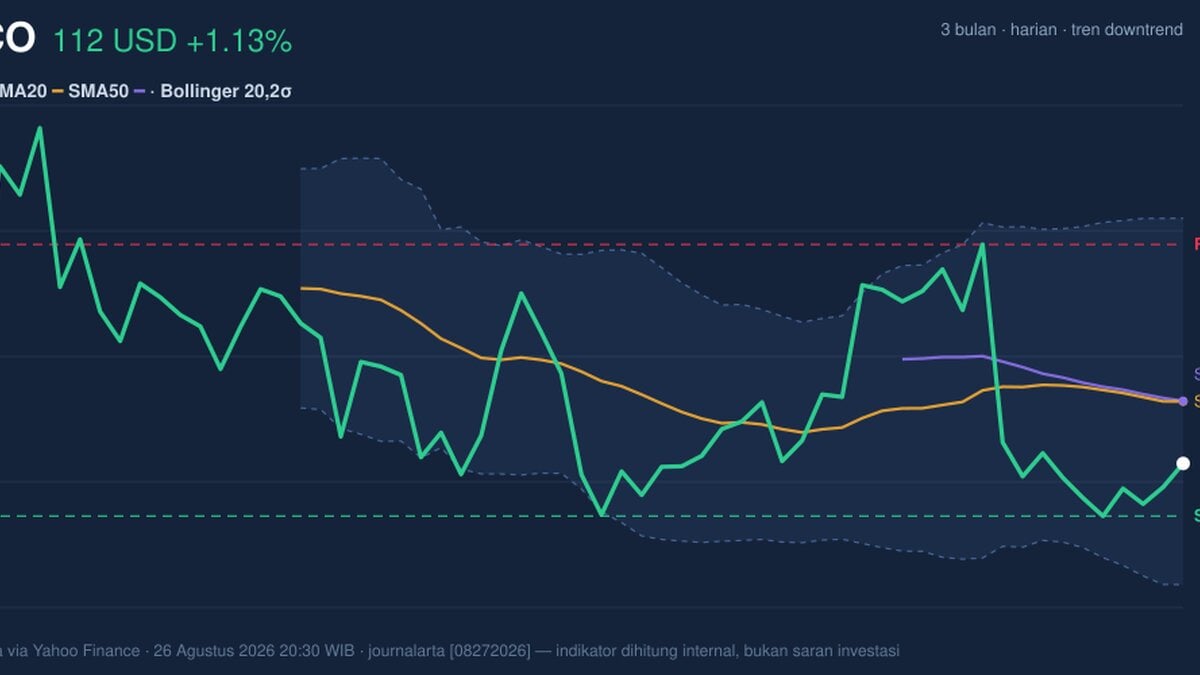
Cisco Systems slipped to 112.36 dollars on Nasdaq, up 1.13% on the day, but the move sits inside a broader pattern that still looks fragile. The shares are trading below the 20-day and 50-day averages, both near 115.62 to 115.65, while the MACD remains negative and volume came in at only 0.5x the 20-day average. That combination matters because it says the rebound has not yet attracted enough participation to reset the trend.
Trend & Price Action
As shown in the chart, Cisco is still operating in a downtrend, with the SMA20 sloping down 0.65% over five days. That slope is a useful signal because it shows the short-term average is falling, not merely flat, which usually means sellers have kept pressure on the stock even when the price bounces. The shares are also sitting below the middle Bollinger band at 115.62, which is the same level as the 20-day average, so the market is still trading under a short-term reference line that often acts like a ceiling in weak tape.
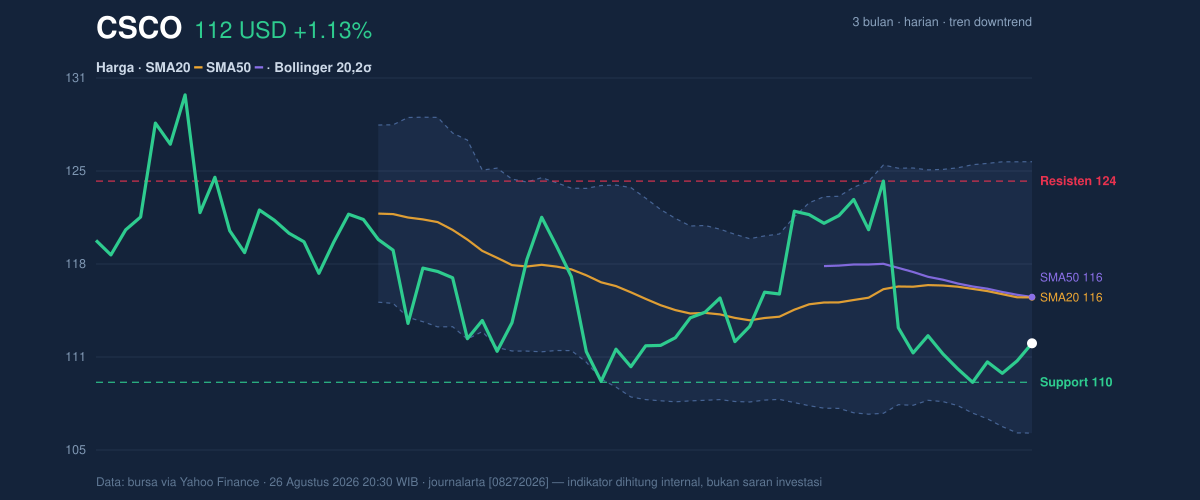
The position inside the recent range is also telling. Cisco is around 19% of the way up from the 20-hour support at 109.59 toward resistance at 123.88, which means the stock is closer to the lower end of its short-term corridor than the upper end. That is not a breakdown, but it does show the market has not reclaimed control. The broader three-month range reinforces that point: the stock remains well below the 130.37 high and above the 107.53 low, leaving it in the middle of a recovery attempt rather than a confirmed advance.
Oscillators & Momentum
The momentum picture is mixed, but not in a reassuring way. The RSI at 45.7 is neutral, which means the shares are neither stretched nor washed out. That sounds balanced, yet in a downtrend a neutral RSI often signals hesitation rather than strength, because buyers have not pushed the indicator into a range that would confirm a firm reversal. The Stochastic %K at 20.2 and %D at 12.9 sits near the lower end of its scale, suggesting the stock is close to oversold territory, but the reading is still classified as neutral. In plain language, that means downside pressure may be cooling, but there is no clean momentum turn yet.
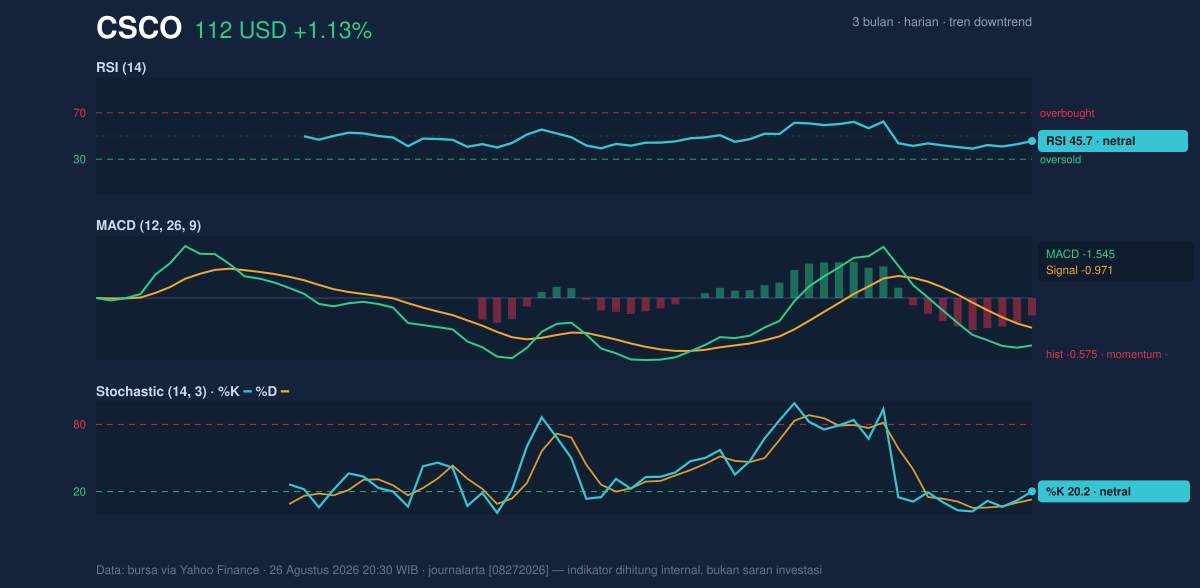
The more important signal is the MACD at -1.545, below its signal line at -0.971, with a histogram of -0.575. That setup usually means downside momentum is still active, even if the stock has managed a one-day bounce. The histogram being negative tells us the MACD line is not yet crossing back into positive momentum, so the rebound is still fighting the trend rather than leading it.
Volatility & Volume
Bollinger Bands help frame how much room the stock has to move. The band width is 16.7%, described as normal, so Cisco is not in a volatility squeeze that would hint at an imminent explosive move. The %B at 33% shows the price is sitting in the lower third of the band structure, which usually reflects weakness but not panic. The lower band at 105.98 is important because it marks the zone where the market would start to test whether the recent decline is becoming a deeper break.
Volatility is moderate rather than extreme, with ATR(14) at 3.42, or about 3.0% of price. That means daily swings are meaningful enough to matter, but not so wide that the chart is disorderly. Volume, however, is the weak link. Last trade volume was 10,287,200, far below the 21,429,065 20-hour average, and OBV is falling. That matters because rising prices on light volume often lack conviction, while a declining OBV suggests money flow has not yet turned supportive.
Key Levels & Scenarios
The nearest support is 109.59. If that floor gives way, the chart would likely shift from a soft downtrend into a more vulnerable breakdown, with the Bollinger lower band at 105.98 becoming the next obvious reference. On the upside, 115.62 to 115.65 is the first barrier, because that is where both the 20-day and 50-day averages sit. A move through that zone would be more meaningful than a single up day, since it would show the stock has reclaimed its short-term trend line.
Above that, the next test is 123.88. That level matters because it sits near the top of the recent range and would signal that buyers have managed to push Cisco out of the lower half of its trading band. If the stock cannot reclaim 115.62, the current bounce remains just that — a bounce within a weak structure, not a reversal.
Technical Verdict: HOLD (wait & see)
HOLD (wait & see)
- The price is below SMA20 and SMA50, and the SMA20 is still sloping lower, which keeps the short-term trend negative.
- The MACD is negative and the OBV is falling, so momentum and participation still lean against the rebound.
- The RSI is neutral and %B is only 33%, which suggests the stock is not oversold enough to call a clean reversal, but also not strong enough to confirm a renewed advance.
- Verdict invalidated if price breaks below 109.59.
- Ideal Entry Range: 109.59 to 115.62, with the upper end only meaningful if the stock starts reclaiming the moving averages.
- Exit Target: 123.88, then 125.25 if momentum improves enough to challenge the upper Bollinger band.
- Stop Loss protection: 105.98, the lower Bollinger band, with 109.59 as the nearer structural support.
For non-traders, this means Cisco has stopped falling sharply, but it has not yet proved that the rebound is strong enough to trust.
Volume: 10,287,200 shares.
Summary Data CSCO
| Last price | 112.36 USD |
| Change 1 day / 5 days / 1 month | 1.13% / 1.64% / -0.11% |
| Trend / MA-cross | downtrend / none |
| SMA20 / SMA50 | 115.62 / 115.65 |
| RSI (14) / Stochastic %K | 45.7 / 20.2 |
| Bollinger %B / ATR | 33% / 3.42 |
| Support / Resistance 20 days | 109.59 / 123.88 |
| Data as of | 26 Agustus 2026 20:30 WIB |
Track CSCO stock price daily: live levels, support/resistance and our full CSCO analysis history.



