CVX Stock Technicals Today: Gains 0.16%, Momentum Weakens
On Agustus 27, 2026: price 200.21 USD, trend uptrend, RSI 58.0, support 186.41, resistance 205.77. technical analysis of cvx stock. CVX Stock Technicals — full…
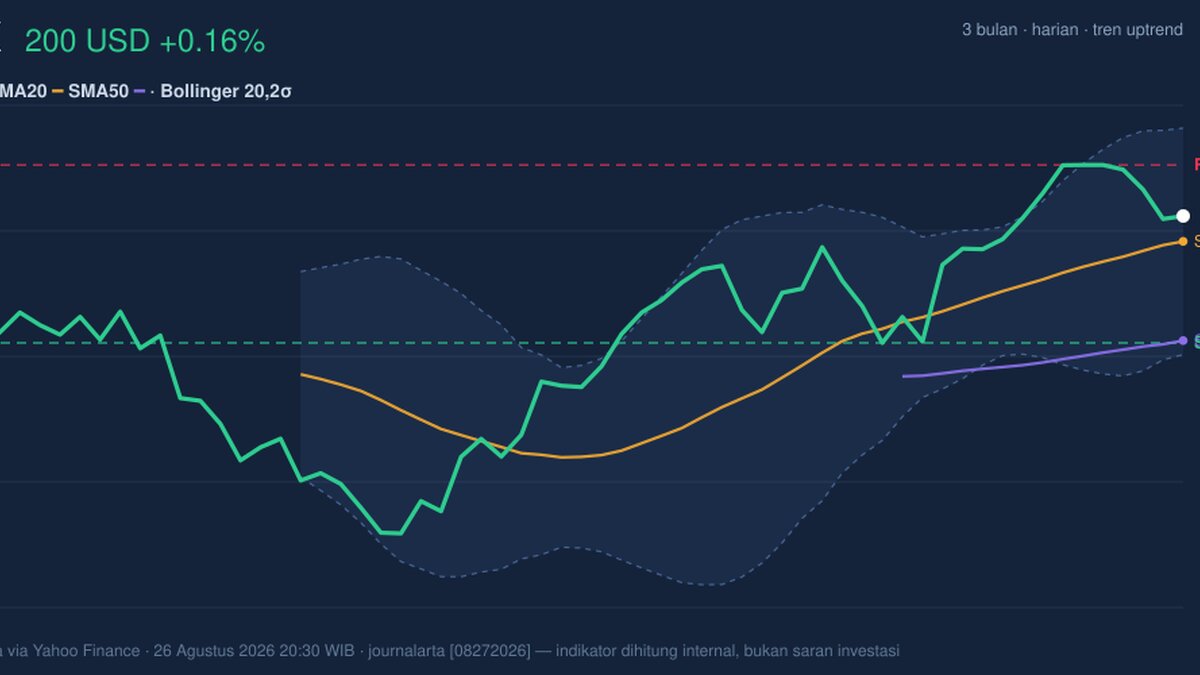
Chevron’s shares edged up to 200.21 on the NYSE, according to Yahoo Finance data at 26 August 2026 20:30 WIB, extending a broader uptrend even as the stock has slipped 2.70% over the past five days. The move leaves CVX above its short- and medium-term trend lines, but the tape is not showing a clean breakout: momentum is mixed, volume is below average, and the stock is sitting just under the upper end of its recent range. That combination matters because it suggests the market is still willing to support the shares, but not yet with the force usually associated with a decisive push higher.
Trend & Price Action
The most important signal in Chevron’s chart is that price remains above both the SMA20 at 197.46 and the SMA50 at 186.66, which keeps the longer structure constructive. In plain terms, the 20-day average acts like a short-term barometer of where buyers and sellers have been agreeing on value; trading above it usually means the recent trend is still intact. The SMA20’s 1.43% rise over five days reinforces that point, showing the near-term slope is still pointing higher rather than flattening out. There is no new MA cross, so the chart is not flashing a fresh trend-change signal; instead, it is showing an established advance that is still being tested.
At the same time, the stock is not far from the top of its recent band. Chevron is trading at 71% of its 20-hour range, with 20-hour support at 186.41 and 20-hour resistance at 205.77. That positioning tells traders the market is leaning upward, but the next leg requires more proof. As shown in the chart, the shares are also below the Bollinger upper band at 209.78, which means price has room to extend before it reaches a zone where short-term enthusiasm often starts to look stretched.
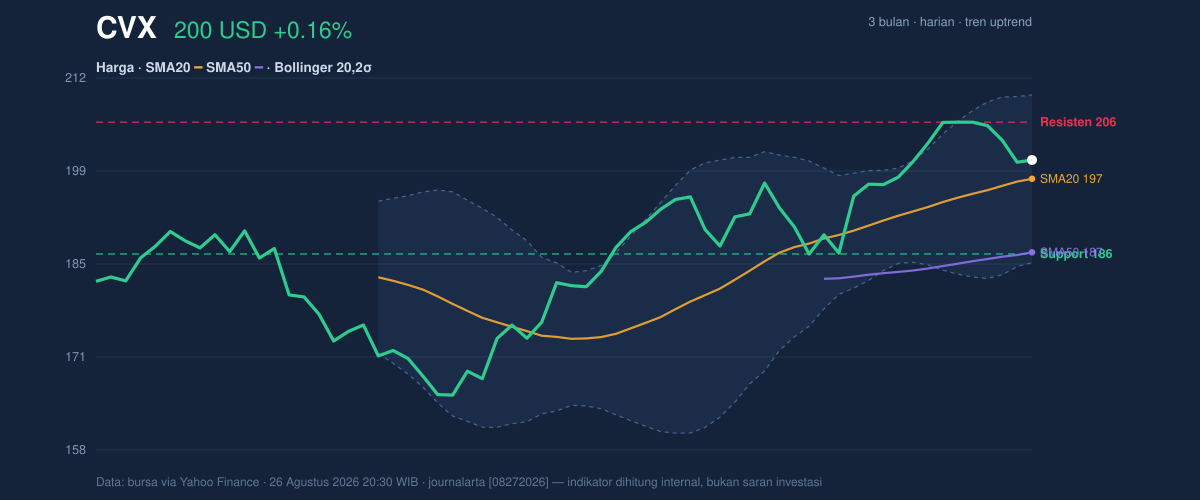
The broader three-month map adds context: the stock’s three-month high of 208.98 is close enough to matter, while the three-month low of 164.78 shows how far the recovery has already come. That matters because markets often pause near prior peaks as investors decide whether the rally has enough earnings and cash-flow support to keep going.
Oscillators & Momentum
The momentum picture is more cautious than the trend picture. Chevron’s RSI at 58.0 sits in neutral territory, which means the stock is neither overbought nor oversold. In practical terms, that is usually a sign of balance: buyers have not exhausted themselves, but neither have they built the kind of one-sided pressure that often precedes a sharp breakout. The Stochastic at 62.1 / 65.7 is also neutral, suggesting the recent rebound has some follow-through but not enough to signal a strong acceleration.
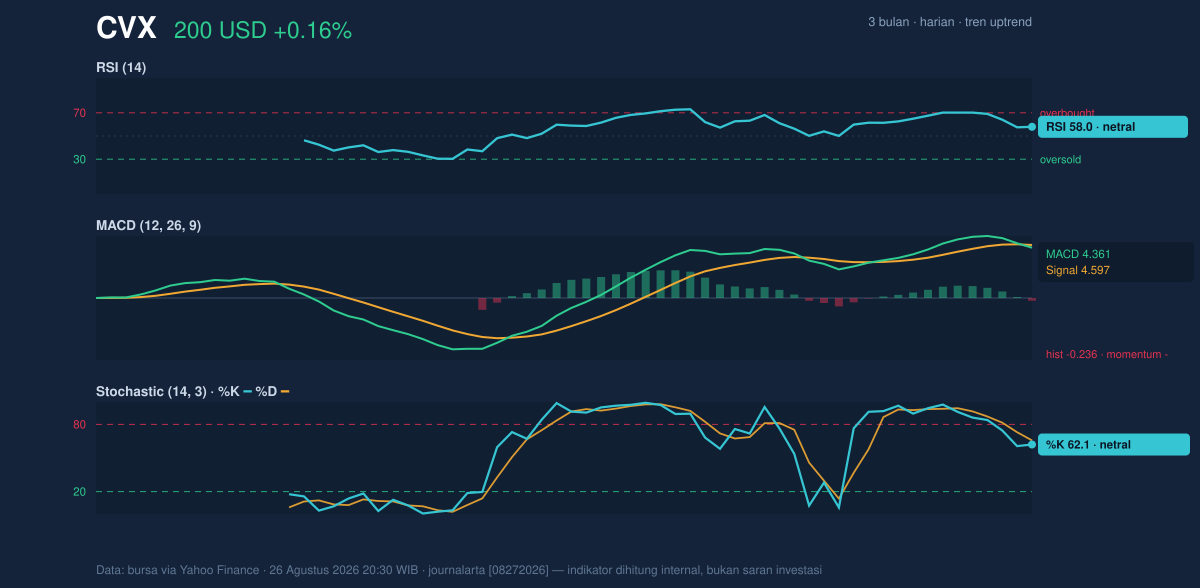
The key nuance is the MACD at 4.361 versus its signal line at 4.597, with a -0.236 histogram. MACD is a trend-following momentum tool; when it sits below the signal line, it usually means upside momentum is losing some force even if the broader trend remains positive. That is exactly the message here: Chevron is still in an uptrend, but the latest push is not yet confirmed by momentum. This is the kind of setup that often produces either a brief consolidation or a renewed advance if buyers step back in with volume.
Volatility & Volume
Volatility is moderate. The ATR(14) at 3.88, equal to 1.9% of price, suggests the stock can still move meaningfully in a session, but not in a disorderly way. The Bollinger Band width of 12.5% is described as normal, which means the chart is not in a squeeze that often precedes a sharp expansion, nor in an overstretched state that would imply immediate exhaustion. With %B at 61%, price is trading in the upper half of the band, a constructive location, but not one that screams breakout.
Volume is the more interesting tell. The latest print of 6,863,100 shares is below the 20-day average of 8,012,505, or about 0.9x normal. That means the recent advance is happening without full market participation, which weakens the conviction behind the move. Still, OBV is rising, and that matters: on-balance volume tracks whether money is generally flowing into or out of a stock. A rising OBV while price holds above support suggests accumulation is still present, even if the day-to-day trading crowd is not especially active.
Key Levels & Scenarios
The chart’s most important reference points are clear. Support at 186.41 sits just above the SMA50 at 186.66, creating a meaningful floor where trend-followers may watch for defense. On the upside, resistance at 205.77 is the first hurdle, followed by the Bollinger upper band at 209.78 and the three-month high at 208.98. If price clears the resistance zone with stronger volume, the chart would be signaling that the recent consolidation has resolved in favor of the bulls. If it fails to hold the support band, the message changes quickly: the uptrend would still exist on paper, but the market would be showing that buyers are losing control of the near-term structure.
Technical Verdict: HOLD (wait & see)
HOLD (wait & see) is the cleanest technical read because the trend is positive, but momentum and participation are not strong enough to call the move confirmed.
- Strongest reasons:
- Price is above the SMA20 and SMA50, which keeps the trend structure intact.
- MACD is below its signal line with a negative histogram, showing momentum is softer than the trend.
- Volume is 0.9x normal, so the latest move lacks strong participation even though OBV is rising.
- Verdict invalidated if price breaks below 186.41, because that would threaten both the support shelf and the area near the SMA50.
- Ideal entry range: 197.46 to 186.66
- Exit target: 205.77 to 209.78
- Stop loss protection: below 186.41
For non-traders, this means Chevron still looks technically healthy, but the chart is asking for proof before the next move becomes convincing.
Summary Data CVX
| Last price | 200.21 USD |
| Change 1 day / 5 days / 1 month | 0.16% / -2.70% / 4.35% |
| Trend / MA-cross | uptrend / none |
| SMA20 / SMA50 | 197.46 / 186.66 |
| RSI (14) / Stochastic %K | 58.0 / 62.1 |
| Bollinger %B / ATR | 61% / 3.88 |
| Support / Resistance 20 days | 186.41 / 205.77 |
| Data as of | 26 Agustus 2026 20:30 WIB |
Track CVX stock price daily: live levels, support/resistance and our full CVX analysis history.



