DBS Stock Technicals Today: Gains 0.90%, Testing Key Resistance
On Agustus 27, 2026: price 76.24 SGD, trend uptrend, RSI 61.6, support 73.55, resistance 76.99. technical analysis of dbs stock. DBS Stock Technicals — full…
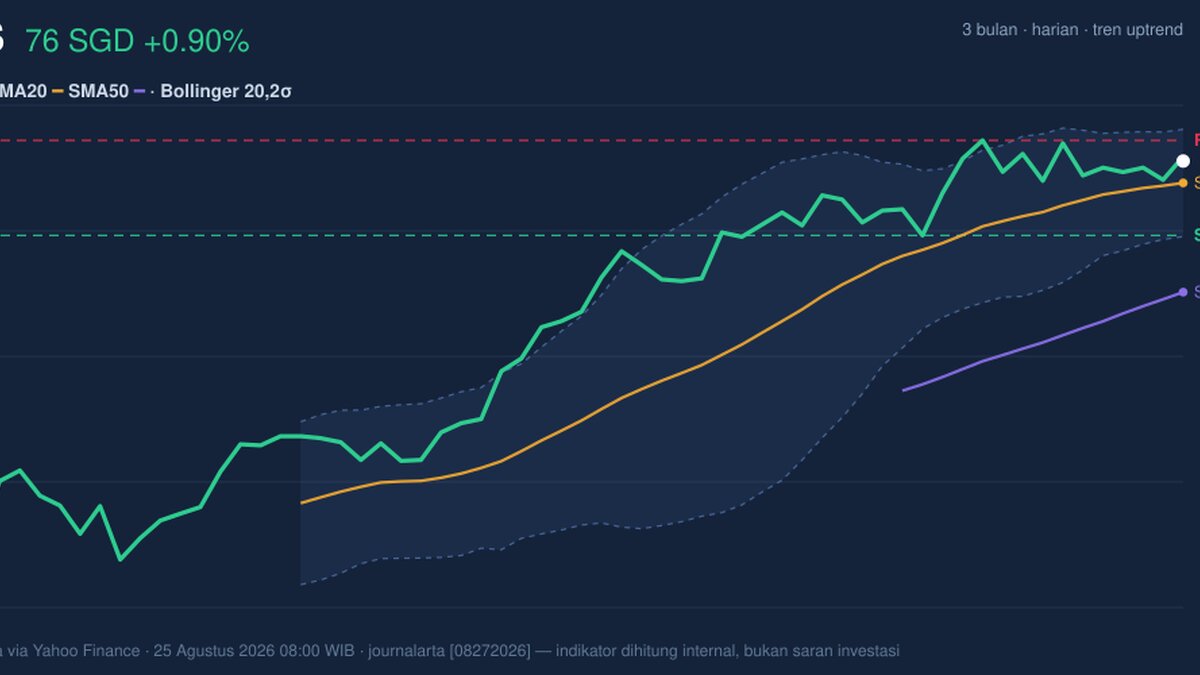
DBS Group ended at 76.24 SGD, up 0.90% from the previous close of 75.56, and the move matters less for its size than for where it sits: the stock is still holding above its short-term trend line, but it is now pressing into the upper half of its recent range, as shown in the chart. That placement suggests buyers have not lost control, yet the latest push is arriving with less conviction than the price action alone would imply.
Trend & Price Action
DBS remains in an uptrend, with the SMA20 at 75.45 and the SMA50 at 71.50. Price is trading above the SMA20, which tells readers the market is still accepting higher prices in the near term, while the wider gap to the SMA50 shows the longer trend has also turned supportive. The SMA20 slope of 0.82% over 5 days is important: a rising short-term average means the recent climb is not just a one-day spike, but a trend with some follow-through. There is no new MA-cross, so the chart is not flashing a fresh trend-change signal; instead, it is showing a trend that is already in place and now being tested near the top of its recent band.
The price is also sitting at 78% of the 20-hour range, with support at 73.55 and resistance at 76.99. That positioning is constructive, but it also means DBS is close to a ceiling that has not yet been cleared. A close above that barrier would tell the market it can absorb supply at the top of the range; failure there would suggest the rally is running into profit-taking rather than fresh demand.
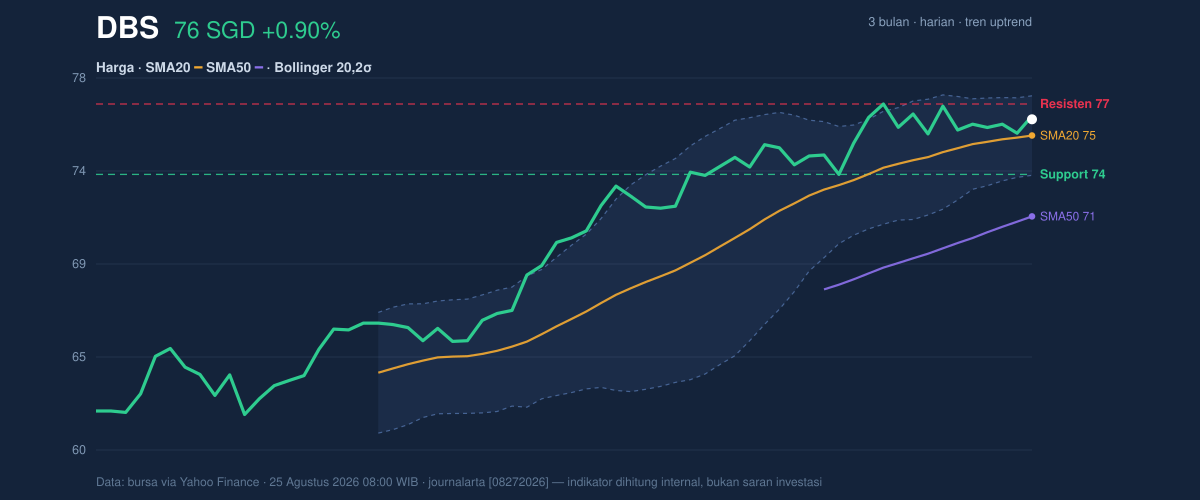
One more signal from the chart matters: the Bollinger band upper level at 77.39 is only slightly above the current price, and the bands are narrowing to 5.1%. In plain English, that squeeze often means the stock is coiling for a larger move, but not yet revealing direction. The market is compressed, not calm.
Oscillators & Momentum
Momentum is less decisive than the trend. The RSI at 61.6 is still neutral, which means the stock is not stretched enough to be considered overheated, but it is also no longer in the “early recovery” zone. The Stochastic %K at 64.9 and %D at 56.6 are also neutral, pointing to upward bias without the kind of force usually seen when a breakout is already underway. In other words, momentum is supportive, but not emphatic.
The more cautionary signal comes from MACD at 1.273 versus the signal line at 1.537, with a histogram of -0.263. MACD is a trend-following indicator, and a negative histogram means the recent pace of price gains is weaker than the underlying trend line would suggest. That does not automatically mean reversal, but it does mean the rally is losing some internal energy even while price remains above key averages.
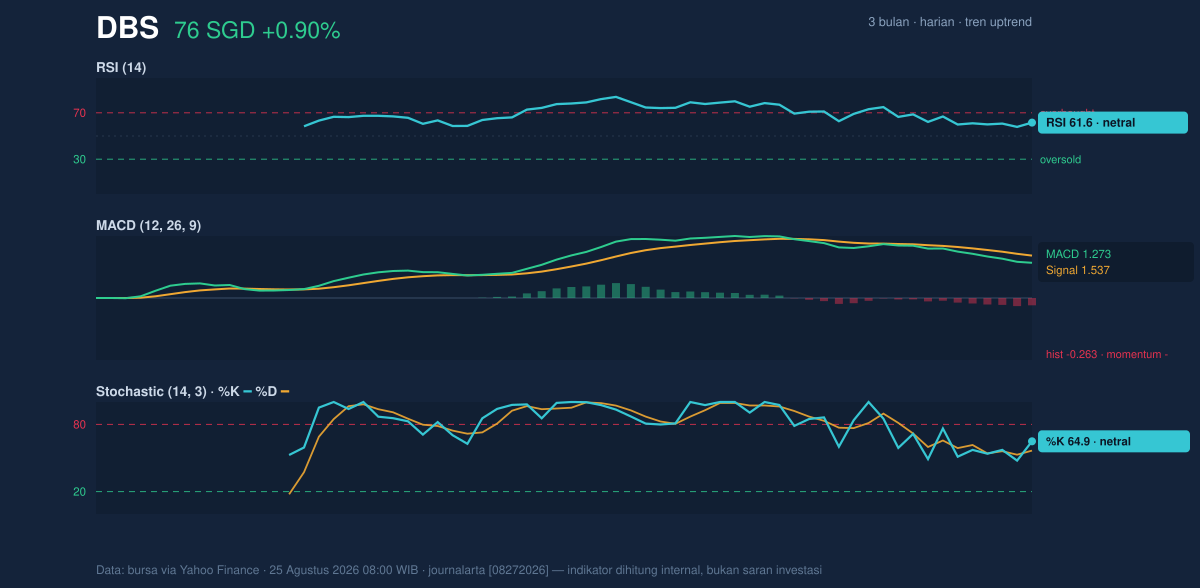
That mix — neutral RSI and Stochastic, but negative MACD momentum — is the classic “trend intact, thrust fading” setup. It often produces either a pause near resistance or a brief pullback that tests whether buyers are still willing to defend the breakout area.
Volatility & Volume
Volatility is present but not extreme. The ATR at 1.35, equal to 1.8% of price, indicates a market that can move meaningfully in a session without becoming disorderly. Combined with the Bollinger squeeze, this suggests DBS may be preparing for a wider directional move after a period of compression. The key question is whether that move is powered by participation or just a thin drift higher.
On that front, the tape is not fully convincing. Last volume of 3,612,800 was only 0.8× normal versus the 20-hour average of 4,650,841, and OBV is down. OBV, or on-balance volume, tracks whether volume is flowing into or out of the stock; a falling line means price gains are not being matched by equally strong accumulation. That is a warning sign when price is near resistance: the market may be rising, but not with broad sponsorship.
Key Levels & Scenarios
The nearest decision zone is tight. Resistance at 76.99 sits just above the last price, while the upper Bollinger band at 77.39 and the 3-month high of 77.97 form the next ceiling cluster. On the downside, support at 73.55 is the first line that matters, followed by the SMA20 at 75.45, which now acts as a dynamic support marker. If DBS clears 76.99 and then holds above 77.39, the chart would be signaling that the squeeze is resolving upward. If it fails to hold 75.45, the market would be showing that the short-term trend is being tested rather than confirmed.
Technical Verdict: HOLD (wait & see)
HOLD (wait & see) — the trend is still positive, but momentum and participation are not yet strong enough to call the current move decisive.
- Reason 1: Price is above the SMA20 and SMA50, with a rising SMA20 slope, which keeps the underlying trend constructive.
- Reason 2: MACD momentum is negative and OBV is down, showing the latest advance is not yet backed by strong accumulation.
- Reason 3: The Bollinger squeeze near 76.99-77.39 suggests a breakout could come, but direction is not confirmed.
- Invalidation: the verdict is invalidated if price falls below 73.55.
- Ideal Entry Range: 75.45 to 73.55
- Exit Target (Target Price): 76.99 to 77.97
- Stop Loss protection: below 73.55
For non-traders, this means DBS is still in a healthy uptrend, but it is not yet showing enough force to say the next move is clearly one-way.
“The market is compressed, not calm.”
Summary Data DBS
| Last price | 76.24 SGD |
| Change 1 day / 5 days / 1 month | 0.90% / 0.69% / 2.50% |
| Trend / MA-cross | uptrend / none |
| SMA20 / SMA50 | 75.45 / 71.50 |
| RSI (14) / Stochastic %K | 61.6 / 64.9 |
| Bollinger %B / ATR | 70% / 1.35 |
| Support / Resistance 20 days | 73.55 / 76.99 |
| Data as of | 25 Agustus 2026 08:00 WIB |
Track DBS share price daily: live levels, support/resistance and our full DBS analysis history.



