Death Cross Pressure, AAPL Stock Gains 1.15% Today
On Agustus 27, 2026: price 313.45 USD, trend sideways, RSI 51.1, support 302.25, resistance 333.43. technical analysis of aapl stock. Death Cross Pressure —…
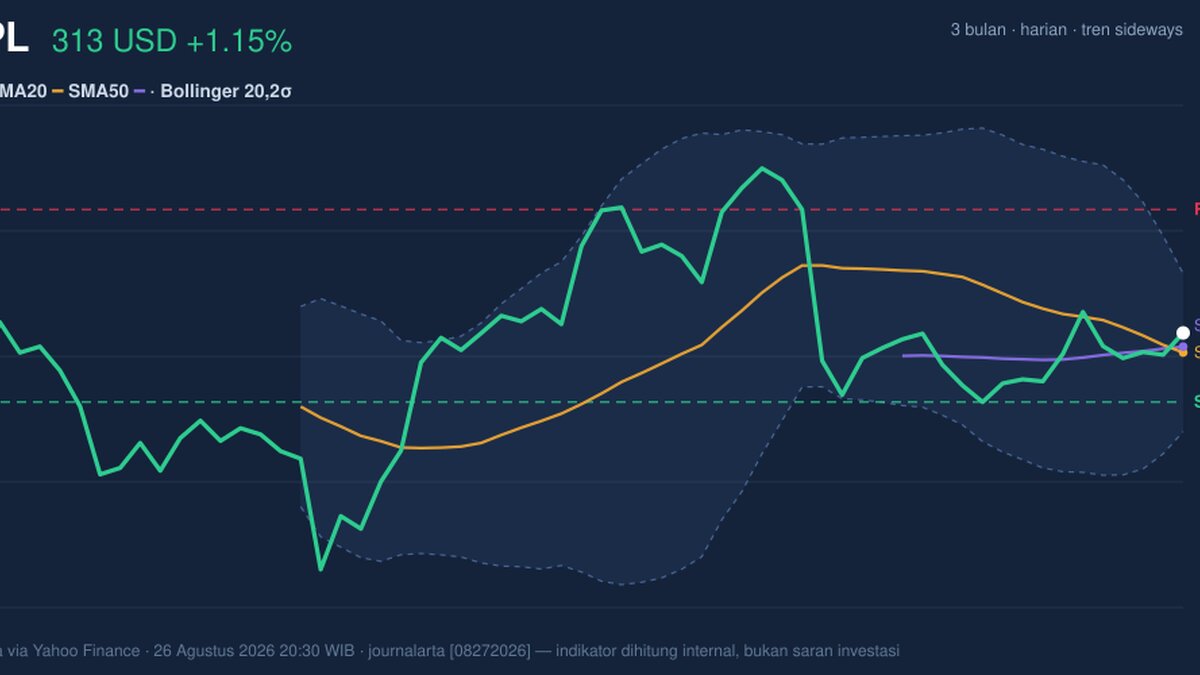
Apple Inc. shares rose to 313.45 USD on NASDAQ, up from a previous close of 309.90, but the move sits inside a broader pattern that still looks more like consolidation than a clean trend. The stock is above its 20-day average yet below its 50-day average, a combination that often signals a market trying to stabilize after weakness rather than one already back in a strong uptrend. As shown in the chart, the price is trading in the middle of its recent band, with buyers and sellers still testing each other.
Trend & Price Action
The most important message in the tape is that Apple is not breaking down, but it is not fully repaired either. The broader trend is sideways, and the SMA20 slope of -1.83% over 5 days shows the short-term path is still drifting lower. That matters because a falling short average means recent trading has been softer than the prior stretch, even though the current price is holding above that line. The death cross — where the 20-day average has moved below the 50-day average — reinforces that the medium-term structure remains cautious. In plain terms, the stock has not yet reclaimed the kind of alignment that usually confirms sustained upside.
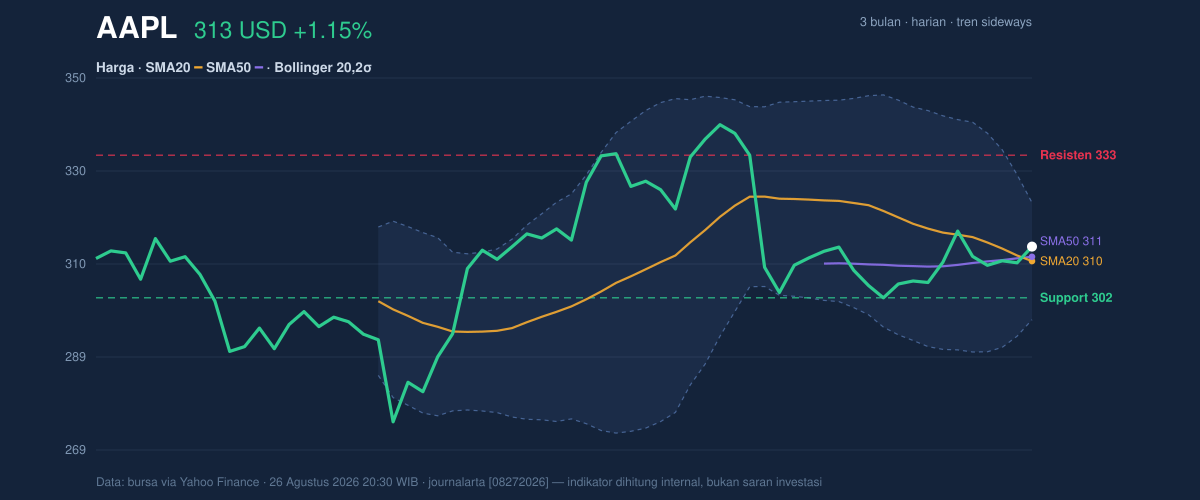
There is still some constructive detail in the location of the price itself. At 313.45 USD, Apple sits above SMA20 at 310.26 and slightly above SMA50 at 311.22 in the immediate sense of price placement, but the moving-average relationship has not fully turned supportive because the cross remains bearish. The stock is also positioned at roughly 36% of the 20-hour range between support at 302.25 and resistance at 333.43, which means it is closer to the lower half of that corridor than to the top. That positioning usually suggests the market is still waiting for a stronger catalyst before committing to a breakout.
Oscillators & Momentum
The momentum signals are mixed, and that mix is the real story. The RSI at 51.1 is neutral, which means the stock is neither stretched nor washed out. That is important because neutral RSI often indicates a market that has room to move in either direction, but no clear momentum edge yet. The Stochastic %K at 65.3 and %D at 54.1 also read as neutral, though the %K is above %D, which hints at short-term improvement. That is not the same as a confirmed breakout; it is more like early recovery pressure.
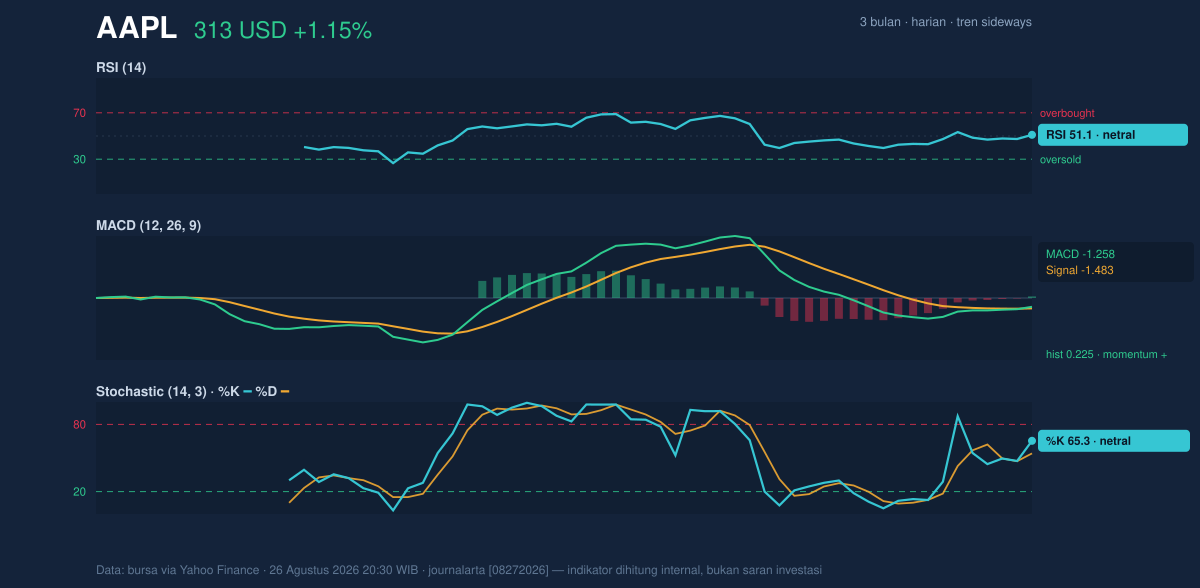
The more encouraging signal comes from MACD at -1.258 versus a signal line at -1.483, with a positive histogram of 0.225. For readers unfamiliar with the term, MACD compares trend speed with its own smoothed version; when the histogram turns positive, it means downside momentum is easing and the faster line is improving relative to the signal line. In Apple’s case, that does not erase the bearish moving-average structure, but it does show that the selloff impulse is losing force. The chart is telling a story of stabilization, not acceleration.
Volatility & Volume
Apple’s volatility is moderate rather than explosive. The ATR of 5.97, equal to 1.9% of price, suggests the stock can still move meaningfully in a session, but not in a disorderly way. That matters because a stock with moderate ATR and a normal Bollinger width often needs a clear trigger to leave the current range. Here, the Bollinger bands show the upper band at 323.06, the middle at 310.26, and the lower at 297.47, with %B at 62% and a band width of 8.2%. In practical terms, price is leaning above the midline but not pressing the upper band, which leaves room for continuation only if buying volume improves.
That volume piece is crucial. Last volume was 33,897,800, well below the 20-day average of 49,863,905, or about 0.7x normal. Lower volume on an upward day often weakens the signal because it suggests the move may not yet have broad participation. Still, OBV is rising, and that means cumulative volume flow has been improving even if the latest session was light. In other words, the market is not seeing aggressive distribution; it is seeing cautious accumulation. That is a subtle but useful distinction.
Key Levels & Scenarios
As shown in the chart, the nearest technical map is clear. Support at 302.25 is the first level that matters if the stock loses traction, while resistance at 333.43 is the ceiling that would need to be cleared to shift the tone from range-bound to more constructive. The Bollinger structure adds a second layer: the 310.26 middle band is acting like a pivot, and the 323.06 upper band is the next checkpoint before the chart can challenge the broader resistance zone.
If Apple holds above the middle band and continues to improve on MACD while volume recovers, the chart can work toward the upper part of the range. If it slips back below 302.25, the recent stabilization would weaken materially, and the market would likely revisit the lower band at 297.47. The 3-month range also frames the bigger picture: the stock is still below the 3-month high of 344.57 and comfortably above the 3-month low of 273.75, which is another way of saying the chart is neither in panic mode nor in a confirmed recovery phase.
Technical Verdict: HOLD (wait & see)
HOLD (wait & see) fits the current setup because the chart is showing stabilization, but not enough confirmation to call a clean trend reversal.
- MACD histogram is positive, which signals easing downside pressure and better short-term momentum.
- RSI at 51.1 and Stochastic at 65.3/54.1 are neutral, so momentum is supportive but not decisive.
- Death cross remains in place and volume is only 0.7x normal, which limits confidence in the rebound.
Verdict invalidated if price breaks below 302.25, because that would weaken the current support base and reopen the lower Bollinger zone.
- Ideal Entry Range: 302.25 to 310.26
- Exit Target: 323.06 to 333.43
- Stop Loss protection: below 297.47
For non-traders, this means Apple is showing signs of recovery, but the chart still needs stronger proof before the move can be treated as durable.
The next technical checkpoint is whether Apple can hold the 310.26 mid-band and then press toward 323.06, with the next session’s volume reading likely to decide whether this is a real turn or just another pause.
Summary Data AAPL
| Last price | 313.45 USD |
| Change 1 day / 5 days / 1 month | 1.15% / -1.07% / -7.32% |
| Trend / MA-cross | sideways / death |
| SMA20 / SMA50 | 310.26 / 311.22 |
| RSI (14) / Stochastic %K | 51.1 / 65.3 |
| Bollinger %B / ATR | 62% / 5.97 |
| Support / Resistance 20 days | 302.25 / 333.43 |
| Data as of | 26 Agustus 2026 20:30 WIB |
Track AAPL stock price daily: live levels, support/resistance and our full AAPL analysis history.



