HSBC Stock Drops 0.44% Today, Momentum Weakens
On Agustus 27, 2026: price 1,522.20 GBp, trend sideways, RSI 49.8, support 1,497.20, resistance 1,597.40. technical analysis of hsbc stock.
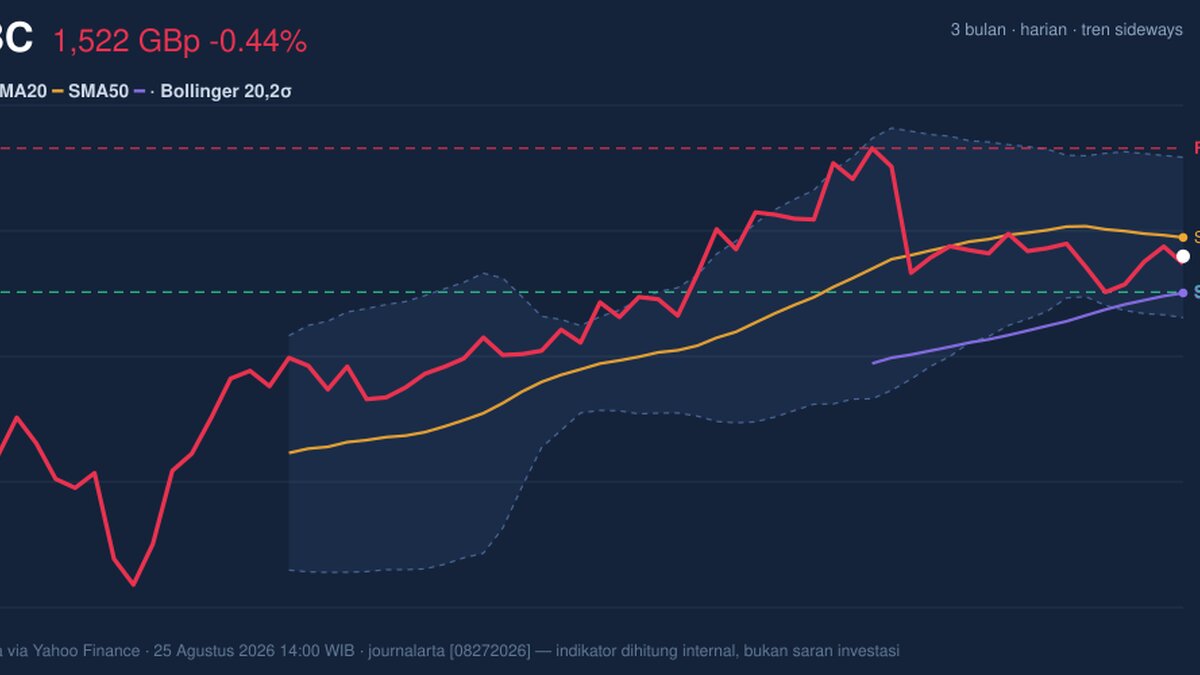
HSBC Holdings’ shares on the LSE slipped to 1,522.20 GBp by 25 August 2026 at 14:00 WIB, down 0.44% on the day, as the stock stayed trapped below its short-term average and near the lower half of its recent trading band. The move matters less for its size than for what it says about market conviction: HSBC is not breaking down, but it is also not yet reclaiming enough momentum to escape a sideways pattern that has defined the tape over the past month. With the price sitting below SMA20 at 1,535.28 but still above SMA50 at 1,496.62, the chart is signalling a pause rather than a decisive trend change.
Trend & Price Action
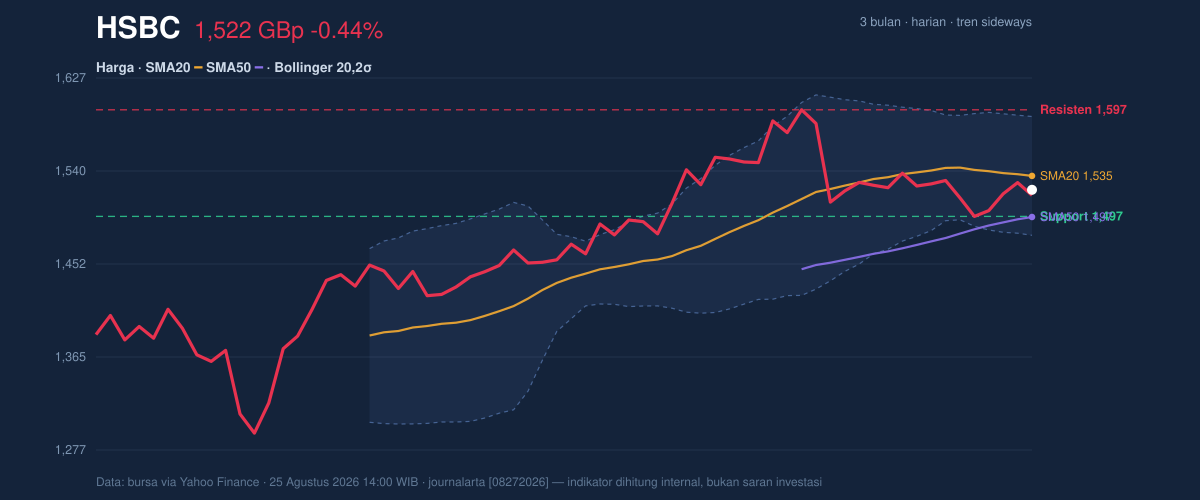
As shown in the chart, HSBC is positioned in a narrow technical corridor: the shares are trading below SMA20 and above SMA50, which usually points to a market that has lost short-term upward drive but has not yet surrendered the broader floor. The SMA20 slope of -0.51% over 5 days reinforces that message. It is a modest downward tilt, not a steep selloff, but it tells traders that recent buying has been insufficient to turn the short-term trend back up.
The absence of a fresh MA-cross is also important. A moving-average crossover often acts as a clean signal that one trend has overtaken another. Here, no new cross means the market is still waiting for confirmation. That uncertainty is reflected in the stock’s position within the band: at 1,522.20 GBp, HSBC is sitting around the lower quarter of the 1,497.20 to 1,597.40 range, which suggests buyers have not yet been able to force the price back toward the top of the recent corridor.
The broader 3-month range adds context. HSBC has already travelled from 1,267.20 to 1,610.00, so the current consolidation is happening after a meaningful run. That often means the market is digesting prior gains rather than pricing in a fresh shock.
[ GRAFIK-HARGA ]
The key message from price action is simple: 1,522.20 GBp is holding above the medium-term floor, but the stock still has to earn its way back above the short-term average.
Oscillators & Momentum
[ GRAFIK-MOMENTUM ]
Momentum indicators are mostly in the middle, which is exactly what one would expect from a stock in consolidation. The RSI at 49.8 is neutral, sitting almost perfectly at the midpoint that separates bullish and bearish territory. That means the market is neither overbought nor oversold; there is no strong emotional excess to fade, but also no clear momentum impulse to chase.
The Stochastic %K at 42.3 and %D at 44.7 tells a similar story. Both lines are below 50 but not deeply weak, which suggests the stock has some room to recover if buyers reappear, yet it is not flashing a reversal signal on its own. In plain language, the oscillator setup says “waiting,” not “turning.”
The more telling signal is the MACD. With MACD at 3.656, signal at 8.944, and a histogram of -5.287, the short-term trend is losing altitude relative to the signal line. A negative histogram means momentum is currently leaning against the price, even if the broader structure has not cracked. This is why the stock can look stable on the chart while still lacking the force needed to push higher.
The combination matters: neutral RSI and Stochastic show no extreme condition, but the negative MACD histogram says the latest price action has not yet converted into positive momentum.
Volatility & Volume
Volatility is not elevated, but it is setting up. HSBC’s ATR(14) of 23.40, equal to 1.5% of price, points to moderate daily movement. That is enough for a meaningful swing, but not enough to suggest disorder. More interesting is the Bollinger Band structure: the upper band stands at 1,591.14, the middle at 1,535.28, and the lower at 1,479.42, with %B at 38% and the band width at 7.3%.
That 7.3% width matters because it indicates a squeeze — a narrowing of the bands that often precedes a sharper move. A squeeze does not tell direction, but it does tell readers that the market is storing energy. With price below the mid-band and only 38% of the way up the Bollinger envelope, the current bias is still subdued. A move back through the middle band would improve the tone; a slip toward the lower band would show the squeeze resolving to the downside.
Volume, meanwhile, is not confirming a strong push in either direction. Last trade volume of 11,660,194 versus the 27,184,828 20-day average means participation was only 0.4x, which is notably quiet. Low volume during a sideways phase usually means conviction is thin. Yet OBV is rising, and that is a subtle but useful counterpoint: on-balance volume tracks whether volume is accumulating on up days or down days. A rising OBV while price drifts near the middle of the range suggests underlying accumulation is still present, even if it is not loud enough to break the chart yet.
Key Levels & Scenarios
The immediate technical map is clear. Support at 1,497.20 is the first line that matters, because it sits just above SMA50 at 1,496.62. That overlap makes the area technically important: if it fails, the market would be losing both a range floor and a medium-term trend marker at once. On the upside, Resistance at 1,597.40 aligns closely with the upper Bollinger band at 1,591.14, so that zone is where the current squeeze could meet selling pressure.
If HSBC can reclaim SMA20 at 1,535.28 and then work toward 1,591.14, the chart would begin to look less defensive. If it cannot hold 1,497.20, the technical tone would weaken quickly because the stock would be testing the same area that has been acting as a medium-term base.
Technical Verdict: HOLD (wait & see)
Reasons:
- RSI 49.8 and Stochastic %K 42.3 / %D 44.7 are neutral, so there is no strong momentum edge.
- MACD histogram -5.287 is negative, showing short-term momentum is still under pressure.
- Price below SMA20 1,535.28 but above SMA50 1,496.62, with a 7.3% Bollinger squeeze, suggests compression rather than confirmation.
Invalidation:
- This verdict is invalidated if price falls below 1,497.20.
Ideal levels:
- Entry Range: 1,497.20 to 1,535.28
- Exit Target: 1,591.14 to 1,597.40
- Stop Loss: below 1,479.42
In plain English: HSBC looks like a stock that is pausing, not one that has clearly chosen its next direction.
The latest 3-month high on the chart is 1,610.00.
Summary Data HSBC
| Last price | 1,522.20 GBp |
| Change 1 day / 5 days / 1 month | -0.44% / 0.50% / -1.69% |
| Trend / MA-cross | sideways / none |
| SMA20 / SMA50 | 1,535.28 / 1,496.62 |
| RSI (14) / Stochastic %K | 49.8 / 42.3 |
| Bollinger %B / ATR | 38% / 23.40 |
| Support / Resistance 20 days | 1,497.20 / 1,597.40 |
| Data as of | 25 Agustus 2026 14:00 WIB |
Track HSBC share price daily: live levels, support/resistance and our full HSBC analysis history.



