HSBC Stock Gains 0.12% Today, Testing Support Level
On Agustus 27, 2026: price 161.70 HKD, trend sideways, RSI 56.1, support 160.10, resistance 168.20. technical analysis of hsbc stock. HSBC Stock Gains — full…
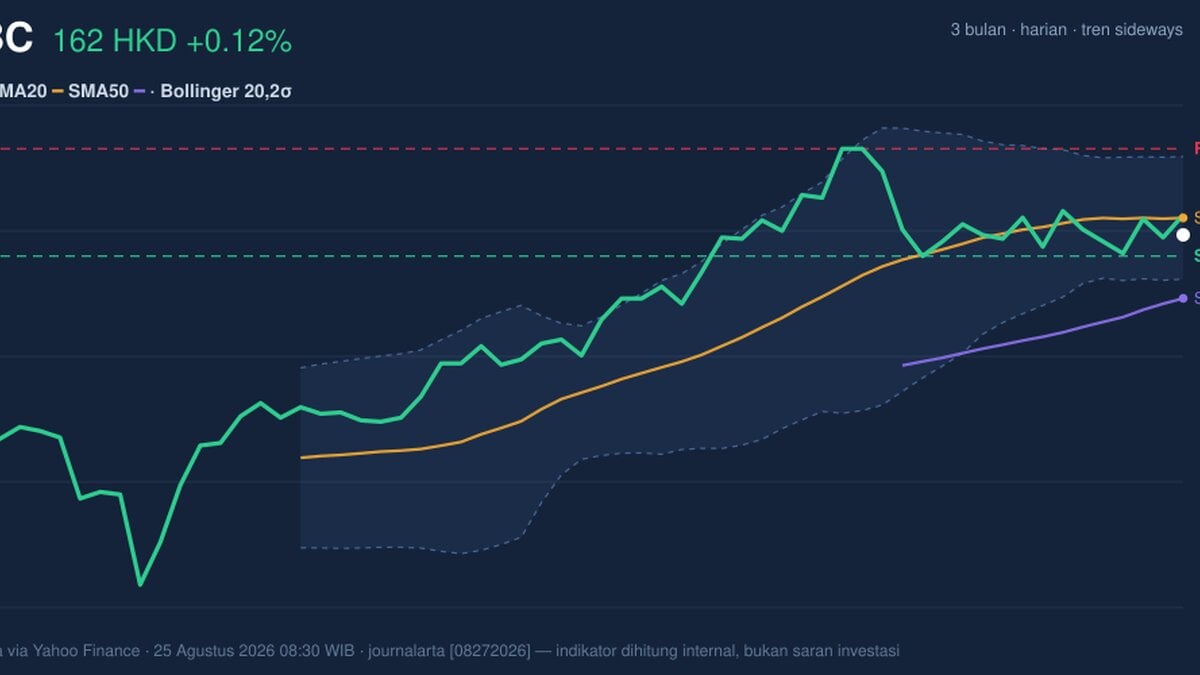
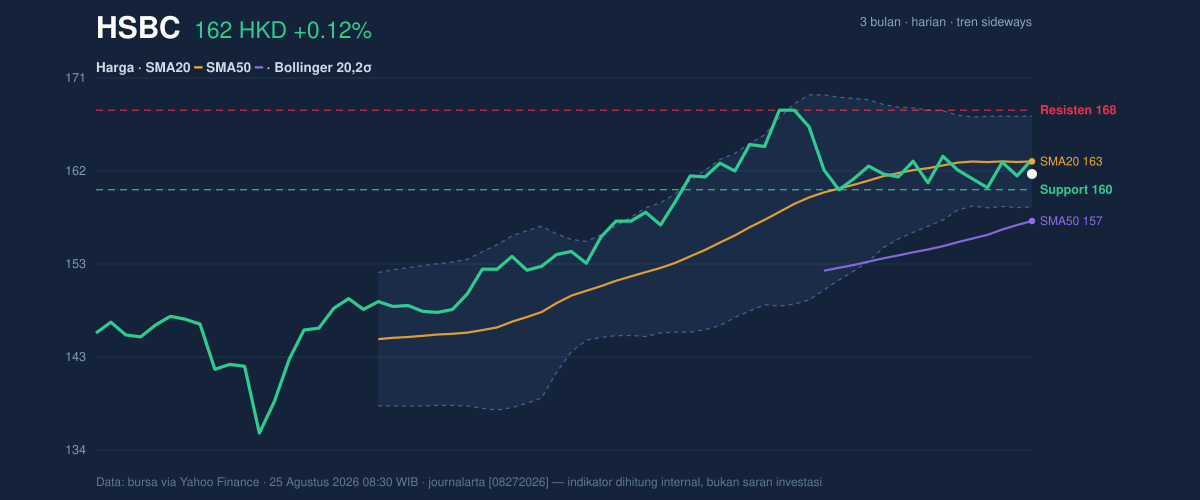
At 161.70 HKD, HSBC Holdings is trading just above the previous close of 161.50, but the more important signal is where the share sits in relation to its moving averages: below the SMA20 at 162.98 yet still above the SMA50 at 156.91. That combination points to a market that has not broken down, but is also not showing the kind of clean upward follow-through that would usually confirm a stronger advance. As shown in the chart, the price is parked near the lower half of its recent range, with the broader setup still described as sideways.
The technical picture is therefore more about hesitation than direction. The 20-day average is rising only modestly, with a slope of 0.08% over 5 days, which means the short-term trend is barely improving rather than accelerating. Price below the SMA20 often tells traders that recent buying has not been strong enough to reclaim the short-term trend line, while staying above the SMA50 suggests longer-term investors have not yet lost control. In plain terms, the stock is stuck between two reference points: the short-term trend is a little weak, but the medium-term structure has not cracked.
Trend & Price Action
No fresh MA cross has appeared, so there is no new signal from the moving averages to suggest a decisive trend change. That matters because a new cross can act as confirmation that a trend is shifting; without it, the market is often just drifting. The price is also sitting at only 20% of the 20-hour range, with 160.10 as near-term support and 168.20 as resistance. That positioning shows the stock is closer to support than resistance, which usually leaves it vulnerable if sellers press again.
The broader three-month range adds context: 169.70 is the recent high, while 133.50 marks the low. HSBC is trading well above the bottom of that band, but still below the top end, which fits the current sideways profile. The market is not in panic mode; it is in a holding pattern.
Oscillators & Momentum
Momentum signals are mixed, and that mix is important. RSI at 56.1 is neutral, meaning the stock is neither stretched nor deeply oversold. But the Stochastic %K at 85.1 versus %D at 58.8 shows the short-term move has become overbought, which often means price has advanced faster than underlying momentum can comfortably support. When stochastic is high while RSI remains neutral, the message is usually not “strong trend,” but “short burst may be tiring.”
That caution is reinforced by the MACD. The MACD at 1.245 is below the signal line at 1.730, and the histogram at -0.485 is negative. In practical terms, MACD is saying the recent upward push has lost traction. Traders often read a negative histogram as a sign that momentum is slipping even if price has not yet broken lower. So while the chart is not bearish in a dramatic sense, it is clearly not showing broad-based momentum confirmation.
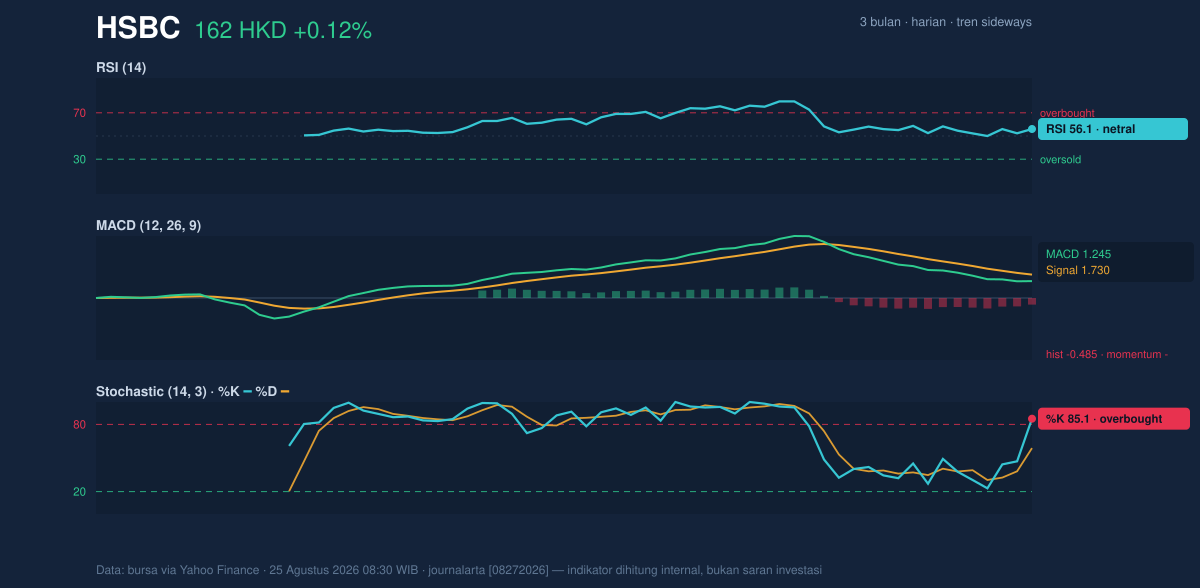
RSI is neutral, Stochastic is overbought, and MACD is negative — that trio usually signals a market that may need to cool before it can extend higher.
Volatility & Volume
Volatility is subdued. ATR(14) at 2.36, or 1.5% of price, indicates relatively low day-to-day movement. That usually limits the chance of a sudden wide swing unless a catalyst appears. The Bollinger Bands tell a similar story: price sits below the middle band at 162.98, with the upper band at 167.61 and the lower band at 158.35. The %B at 36% shows price is leaning toward the lower half of the band, while the 5.7% band width suggests a squeeze. A squeeze matters because it often precedes a larger move, but it does not tell direction by itself; it simply says the market has become compressed and may be storing energy.
Volume is not yet validating a bullish break. Last volume was 7,585,911, versus a 20-day average of 12,956,491, or about 0.6× normal. That is thin participation. When volume drops while OBV also falls, it means accumulation is not obvious and buyers are not showing strong commitment. In a squeeze environment, weak volume can be a warning that any move higher may struggle to sustain itself without broader participation.
Low volume, falling OBV, and a Bollinger squeeze together point to a market waiting for a catalyst rather than one already in motion.
Key Levels & Scenarios
The key support to watch is 160.10. If that level gives way, the stock would likely be testing the lower Bollinger band at 158.35, with the SMA50 at 156.91 becoming the next technical reference. On the upside, 162.98 is the first hurdle because it is also the SMA20 and Bollinger middle band; reclaiming it would suggest the short-term drift is improving. Above that, 167.61 and then 168.20 form the next resistance zone, with 169.70 the three-month high beyond that.
The signal structure is fairly clear: if HSBC can close back above the SMA20 with better volume, the squeeze could resolve upward. If it fails to hold 160.10, the market would be telling investors that the recent sideways range is starting to lean lower. The present setup is therefore less about trend strength and more about whether support can absorb selling pressure.
Technical Verdict: HOLD (wait & see)
HOLD (wait & see) fits best because the chart shows price below the SMA20, MACD momentum is negative, and volume is below average with OBV declining. At the same time, the stock remains above the SMA50 and the Bollinger Bands are squeezed, which means the market has not yet chosen a clear direction.
- Ideal Entry Range: 160.10 to 162.98, where support and the SMA20 overlap.
- Exit Target: 167.61 to 168.20, the upper Bollinger band and nearby resistance.
- Stop Loss protection: below 158.35, with the 156.91 SMA50 as the deeper technical line.
This means the stock is not showing enough confirmation to call a clean trend, but it is also not weak enough to signal a breakdown.
HSBC’s next technical test is 160.10, the 20-hour support level.
Summary Data HSBC
| Last price | 161.70 HKD |
| Change 1 day / 5 days / 1 month | 0.12% / -0.25% / -0.19% |
| Trend / MA-cross | sideways / none |
| SMA20 / SMA50 | 162.98 / 156.91 |
| RSI (14) / Stochastic %K | 56.1 / 85.1 |
| Bollinger %B / ATR | 36% / 2.36 |
| Support / Resistance 20 days | 160.10 / 168.20 |
| Data as of | 25 Agustus 2026 08:30 WIB |
Track HSBC share price daily: live levels, support/resistance and our full HSBC analysis history.



