Momentum Weakens, Alibaba Stock Gains 3.64% Today
On Agustus 27, 2026: price 116.60 HKD, trend sideways, RSI 43.7, support 111.80, resistance 128.10. technical analysis of alibaba stock.
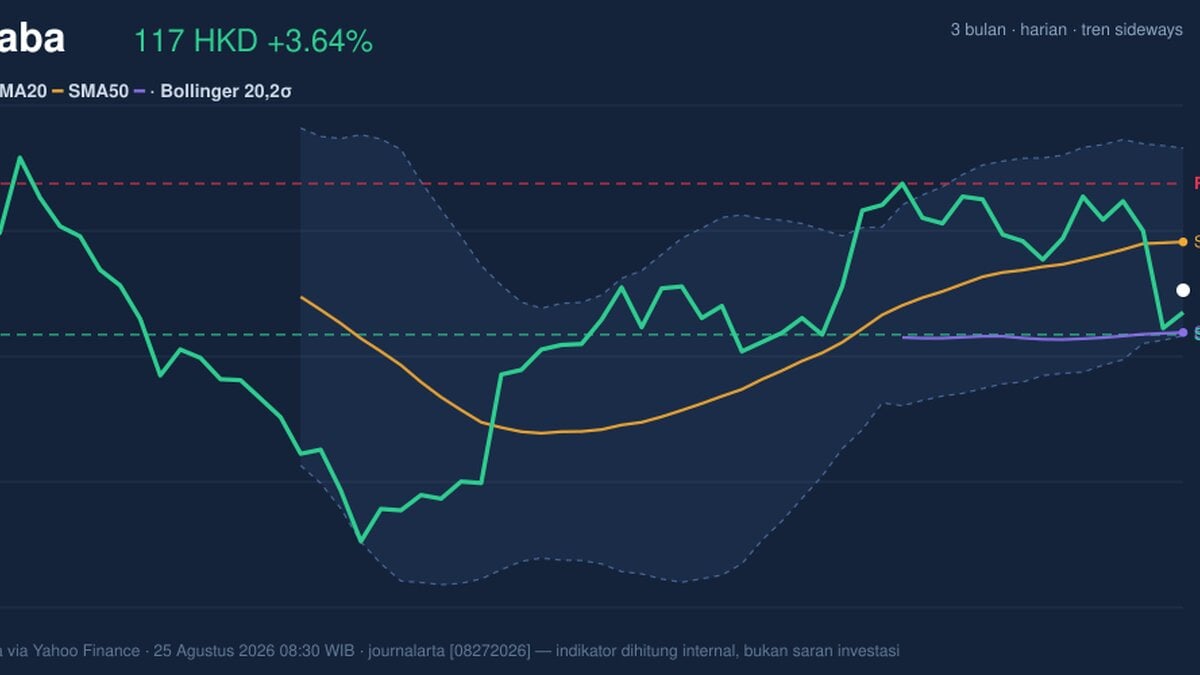
Alibaba Group’s Hong Kong-listed shares rose to 116.60 HKD on the Hong Kong exchange, up from 112.50 HKD at the previous close, but the move still leaves the stock below its short-term trend line and inside a technically mixed range. The chart shows a market that has bounced, yet not convincingly repaired the damage from the recent pullback: price is below the SMA20 at 121.81 while remaining above the SMA50 at 112.03, a setup that often signals consolidation rather than a clean trend. In plain terms, Alibaba is neither in a strong uptrend nor in a breakdown; it is trading in the middle ground, where confirmation matters more than the headline gain.
Trend & Price Action
The broader read is still sideways, and that matters because sideways trends usually reward patience rather than urgency. The SMA20’s slope is 1.61% over 5 days, which suggests the short-term line is still tilting upward, but price sitting below the SMA20 means buyers have not yet reclaimed control of the recent move. No new MA-cross has appeared, so there is no fresh signal that the medium-term structure has flipped decisively in either direction. The stock’s position within the recent band is also telling: at 29% of the 20-day range, Alibaba is closer to the lower half of that range than the upper boundary, even after the day’s advance.
That is not a breakout profile. It is a repair job.
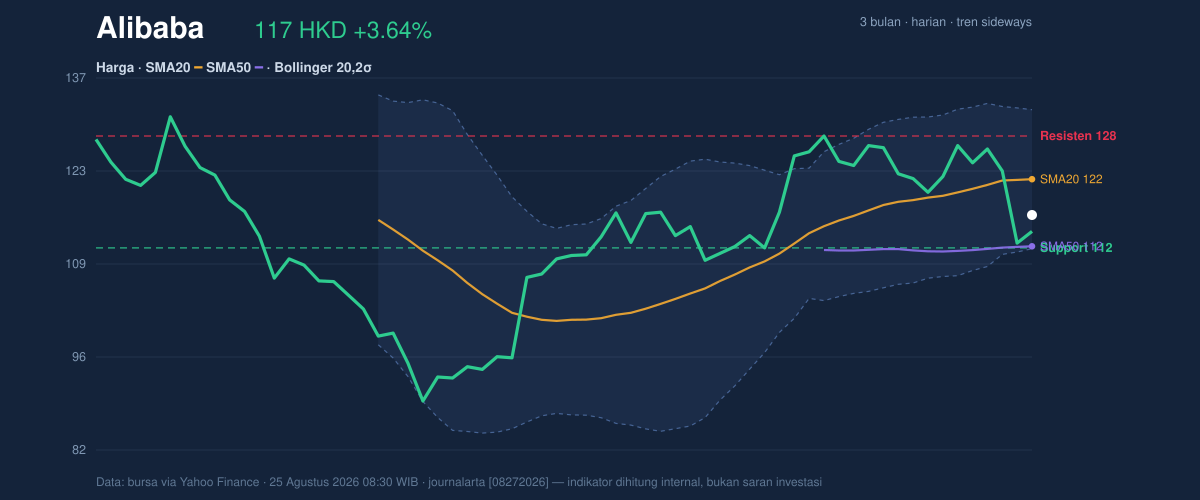
The important context is the 3-month frame. Alibaba’s 3-month high is 131.20 and the 3-month low is 88.65, so the current price is still well above the floor but meaningfully below the peak. That gap explains why rallies can still fade: the market has room to recover, but it has not yet shown enough follow-through to force a re-rating of the chart structure.
Oscillators & Momentum
Momentum indicators are not confirming the day’s rise. RSI at 43.7 is neutral, which means the stock is not stretched on the upside or deeply oversold; it is simply uncommitted. The Stochastic %K at 20.3 and %D at 23.4 sits near the lower end of its range, hinting that the rebound may be early-stage, but not yet strong enough to call a reversal. Stochastic often turns before price does, so a low reading can matter — but only if it starts lifting above its signal line and holds there.
The more cautionary signal is MACD. MACD at 1.277 is still below the signal line at 2.751, and the histogram at -1.474 remains negative. That combination means the short-term pace of gains is still lagging the longer-term trend baseline. In practical terms, the stock can rise while momentum remains weak; that is often what a fading rebound looks like before either a stronger recovery or another leg lower.
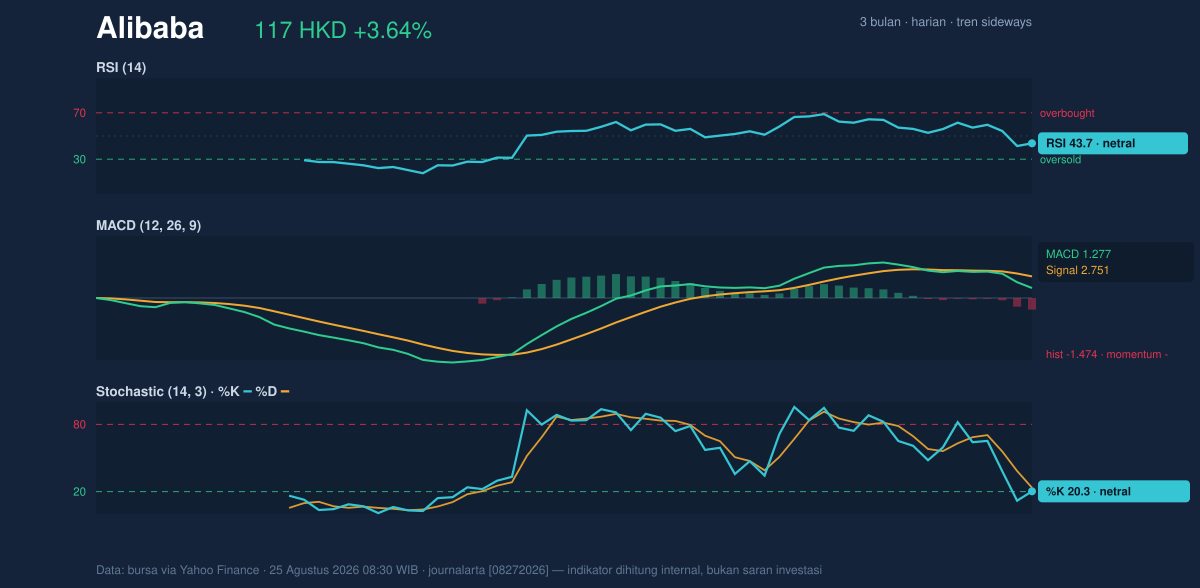
So the oscillators are not bearish enough to scream breakdown, but they are not strong enough to validate the bounce either.
Volatility & Volume
Volatility is elevated. ATR(14) at 5.09, equal to 4.4% of price, says the stock can move a meaningful distance in a single session. That is important because a stock trading near the middle of its range can quickly test either side once volatility expands. The Bollinger Band picture is balanced rather than stretched: the upper band is 131.94, the middle band is 121.81, and the lower band is 111.68, while the %B at 24% shows price sitting in the lower portion of the band structure. The 16.6% band width is described as normal, so there is no squeeze suggesting an imminent explosive move, but the current placement near the lower band means the stock is still vulnerable if momentum weakens again.
Volume adds a mixed but useful clue. Last volume was 124,296,637, about 1.2× normal versus the 20-day average of 106,128,008. That tells us the move is not happening on thin trading, which is constructive. Yet OBV is down, and that is the key caveat: on-balance volume falling while price rebounds usually means selling pressure has not been fully absorbed. In other words, the market is participating, but not necessarily endorsing the move.
Key Levels & Scenarios
The nearest technical map is clear. Support at 111.80 sits just above the Bollinger lower band at 111.68 and very close to the SMA50 at 112.03, creating a cluster that should matter to traders watching whether the stock can hold its base. On the upside, resistance at 128.10 is the first major test before the upper Bollinger band at 131.94 and the 3-month high at 131.20. That means the market has a defined ceiling well above the current price, and it will need stronger momentum to challenge it.
If price holds above 111.80 and starts reclaiming 121.81, the chart would begin to look less defensive and more constructive. If it loses 111.80, the current range loses its base and the lower band area becomes exposed. The signal to watch is not just direction, but whether price can move back through the mid-band and hold there.
Technical Verdict: HOLD (wait & see)
HOLD (wait & see) is the cleanest read from the current setup.
- Price is below the SMA20 at 121.81, so the short-term trend has not been fully reclaimed.
- MACD is negative with the histogram below zero, showing momentum still lags the rebound.
- RSI at 43.7 and Stochastic near the low end suggest the stock is not oversold enough to demand action, but not strong enough to confirm a breakout.
- The verdict is invalidated if price falls below 111.80, because that would break support aligned with the Bollinger lower band and the SMA50.
- Ideal Entry Range: 111.80 to 112.03
- Exit Target: 121.81 to 128.10
- Stop Loss Protection: below 111.68
For non-traders: the chart says Alibaba is recovering, but it has not yet proven that the rebound is strong enough to trust.
Summary Data Alibaba
| Last price | 116.60 HKD |
| Change 1 day / 5 days / 1 month | 3.64% / -7.97% / 4.11% |
| Trend / MA-cross | sideways / none |
| SMA20 / SMA50 | 121.81 / 112.03 |
| RSI (14) / Stochastic %K | 43.7 / 20.3 |
| Bollinger %B / ATR | 24% / 5.09 |
| Support / Resistance 20 days | 111.80 / 128.10 |
| Data as of | 25 Agustus 2026 08:30 WIB |
Track Alibaba share price daily: live levels, support/resistance and our full Alibaba analysis history.



