Momentum Weakens, BP Stock Drops 2.06% Today
On Agustus 27, 2026: price 522.70 GBp, trend sideways, RSI 49.9, support 514.90, resistance 552.50. technical analysis of bp stock. Momentum Weakens — full…
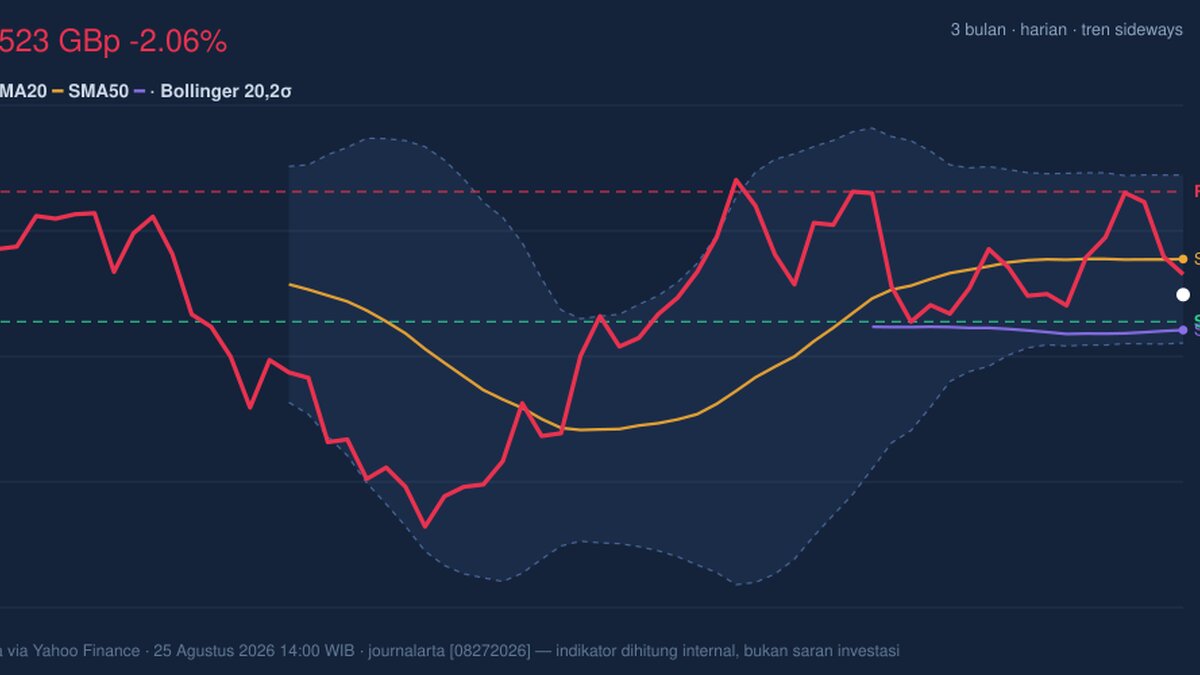
BP plc is stuck in a narrow trading band on the London market, and the latest signals suggest the shares are still waiting for a cleaner direction rather than breaking into a fresh trend. At 522.70 GBp, the stock finished 2.06% lower on the day and now sits below its 20-day average of 533.04, a small but important sign that near-term momentum has softened even though the broader setup remains sideways.
Trend & Price Action
As shown in the chart, BP is trading in the middle of a fairly contained range, with the share price below SMA20 but still above SMA50 at 512.50. That positioning matters. It says the stock has lost some short-term traction, yet the longer base has not been broken. In plain terms, the market is not rejecting the shares outright; it is simply not paying up for them at this stage.
The absence of a new MA-cross also reinforces that message. A moving-average cross is often used to mark a change in trend, but here there is no fresh signal to suggest either a strong bullish turn or a deeper bearish reversal. The sideways trend and the 0.00%/5-day slope on SMA20 point to a market that has paused, not one that is trending decisively.
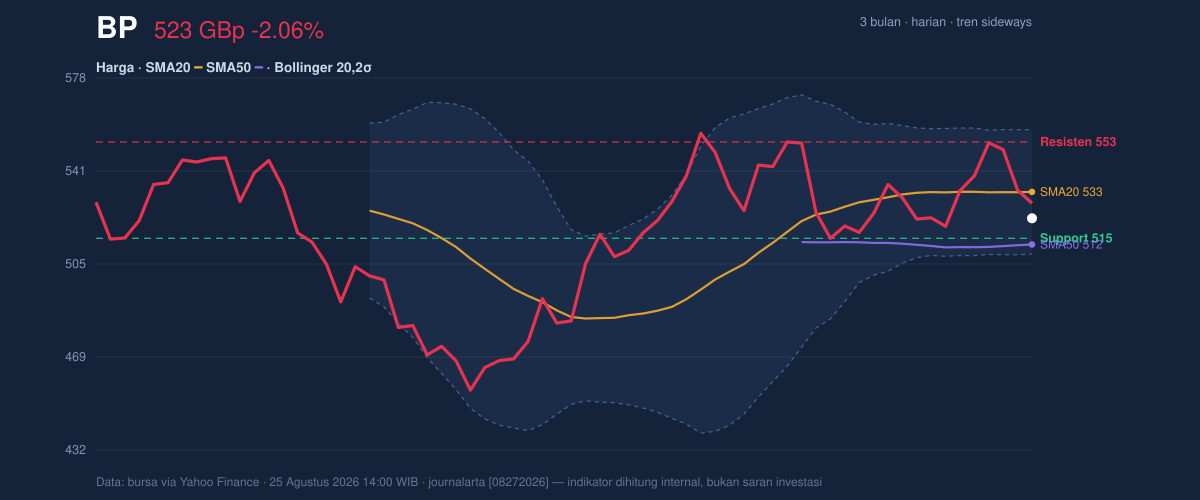
BP is also trading near the lower half of its recent band. The stock is at 21% of the 20-hour range, with support at 514.90 and resistance at 552.50. That location is telling: the market has room to recover before it confronts the upper boundary, but it is close enough to support that any further weakness could quickly invite tests of the lower Bollinger band and the recent floor around the 514.90 area.
Oscillators & Momentum
The momentum picture is mixed, and that is exactly what a sideways chart should look like. RSI at 49.9 is effectively neutral, meaning the shares are neither overbought nor oversold. That matters because it suggests there is no strong emotional excess in the market yet; traders are still undecided.
Stochastic %K at 36.5 versus %D at 52.7 is softer than RSI and points to waning short-term strength. Stochastic tends to react faster than RSI, so when it slips below its signal line while the overall trend is flat, it often means recent buying pressure is fading before the broader trend has fully rolled over.
The more cautionary signal comes from MACD. MACD at 4.813 is below the signal line at 5.123, with a histogram of -0.309. That negative histogram means momentum is slightly leaning to the downside; it does not confirm a major downtrend, but it does show that the latest price action has been weaker than the earlier trend that pushed the indicator higher.
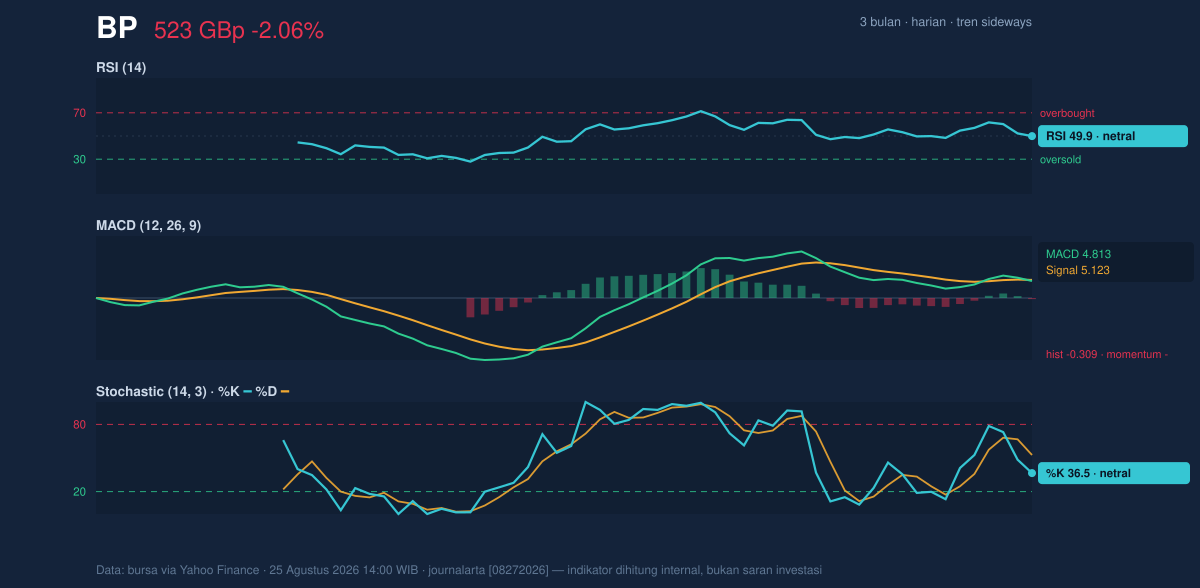
In other words, the oscillator set is not screaming “sell,” but it is also not supporting an immediate upside breakout. The indicators are aligned with a market that is drifting, not charging.
Volatility & Volume
Volatility is moderate rather than elevated. ATR at 12.03, or 2.3% of price, suggests BP can still move meaningfully in a session, but not in a disorderly way. The Bollinger Band width of 9.1% is normal, which indicates the stock is not in a volatility squeeze that typically precedes a sharp expansion. There is no obvious compression signal here to suggest an imminent explosive move.
Price is sitting at %B of 29%, which places it in the lower portion of the Bollinger structure. That means the shares are closer to the lower band at 508.74 than to the upper band at 557.33. For readers unfamiliar with the term, %B shows where price sits inside the Bollinger envelope: lower readings imply the stock is trading nearer the downside edge of its recent range.
Volume adds a further note of caution. The latest turnover of 21,586,077 is only 0.4× the 20-session average of 49,776,865, and OBV is falling. OBV, or on-balance volume, tracks whether volume is broadly supporting price rises or declines. A falling OBV while price is soft tells us the latest weakness is not being strongly absorbed by buyers. That does not confirm a breakdown, but it does mean recovery attempts may lack conviction unless participation improves.
Key Levels & Scenarios
The immediate technical map is clear. Support at 514.90 is the first line that matters, with the lower Bollinger band at 508.74 acting as the next downside reference if that level gives way. On the upside, resistance at 552.50 is the first hurdle, followed by the upper Bollinger band at 557.33. The stock’s position inside the range means both sides remain live, but neither has yet won control.
If BP holds above 514.90 and recovers back through SMA20 at 533.04, the chart would begin to look more constructive, especially if volume improves and MACD starts to flatten. If it fails to hold 514.90, the market would likely test the lower band at 508.74, and that would raise the risk of a deeper move toward the 3-month low of 450.60. On the other hand, a move through 552.50 would shift the stock back toward the upper half of its recent range and bring 562.90, the 3-month high, back into view.
Technical Verdict: HOLD (wait & see)
HOLD (wait & see)
- RSI at 49.9 and Stochastic at 36.5/52.7 show neutral-to-soft momentum, not a decisive breakout setup.
- MACD below signal with a -0.309 histogram points to mild downside pressure, while the sideways SMA20 slope argues against a strong trend.
- Price below SMA20 but still above SMA50 keeps BP in a middle ground: not broken, not confirmed strong.
Verdict invalidated if price breaks below 508.74, because that would mean the stock has fallen through the lower Bollinger support and the current range is failing.
- Ideal Entry Range: 514.90 to 533.04
- Exit Target: 552.50 to 557.33
- Stop Loss Protection: below 508.74
In plain English: BP is not showing enough strength for a clean positive technical signal, but it is also not weak enough to confirm a full breakdown.
The next technical test is whether the shares can reclaim 533.04 on firmer volume, with the market now watching the 514.90 support line after the latest close at 522.70 GBp.
Summary Data BP
| Last price | 522.70 GBp |
| Change 1 day / 5 days / 1 month | -2.06% / -2.02% / -0.57% |
| Trend / MA-cross | sideways / none |
| SMA20 / SMA50 | 533.04 / 512.50 |
| RSI (14) / Stochastic %K | 49.9 / 36.5 |
| Bollinger %B / ATR | 29% / 12.03 |
| Support / Resistance 20 days | 514.90 / 552.50 |
| Data as of | 25 Agustus 2026 14:00 WIB |
Track BP share price daily: live levels, support/resistance and our full BP analysis history.



