Momentum Weakens, UNH Stock Gains 1.11% Today
On Agustus 27, 2026: price 401.01 USD, trend downtrend, RSI 47.7, support 384.85, resistance 421.47. technical analysis of unh stock. Momentum Weakens — full…
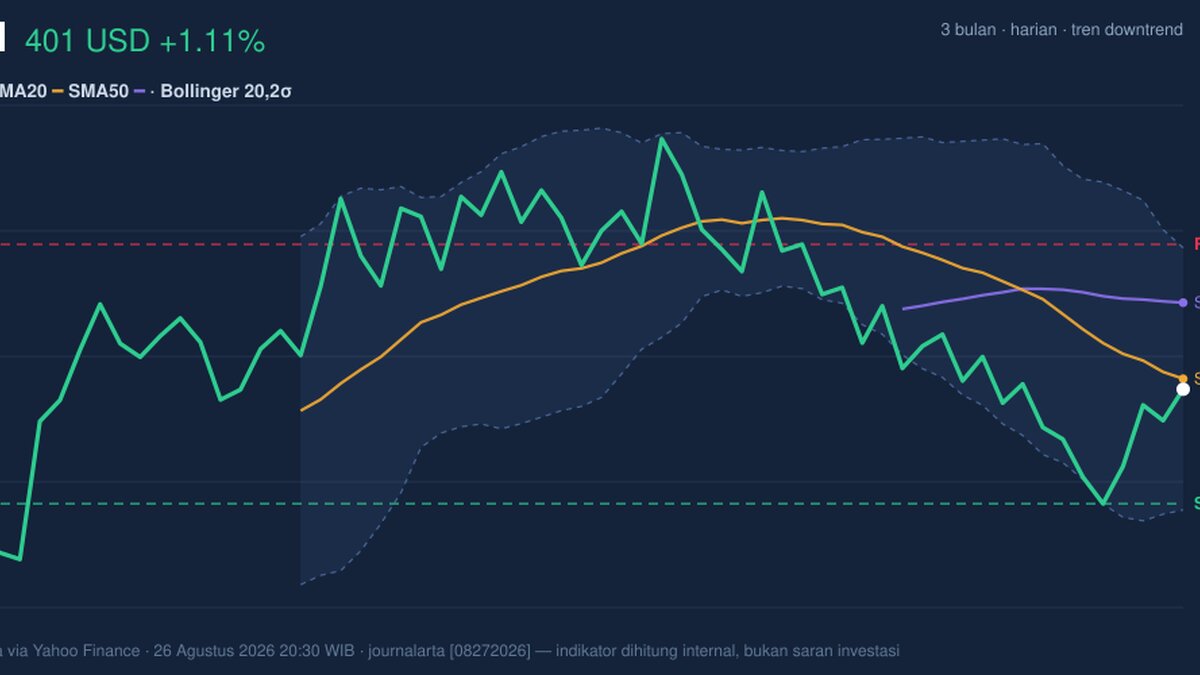
UnitedHealth Group’s shares on the NYSE rose to 401.01 on 26 August 2026, up 1.11% from the previous close, but the move still leaves the stock below its short-term trend line and inside a broader downtrend. The number matters because it shows buyers are willing to step in after recent weakness, yet not strongly enough to reclaim the levels that would signal a cleaner recovery.
Trend & Price Action
As shown in the chart, UNH is trading below SMA20 at 402.47 and well under SMA50 at 413.22, which means the stock is still priced beneath both its near-term and medium-term averages. In practical terms, that usually tells investors the recent bounce is happening inside a falling structure rather than ending it. The chart also shows the 20-day moving average is sloping down -1.71% over 5 days, a sign that the trend is still leaning lower even after the latest gain.
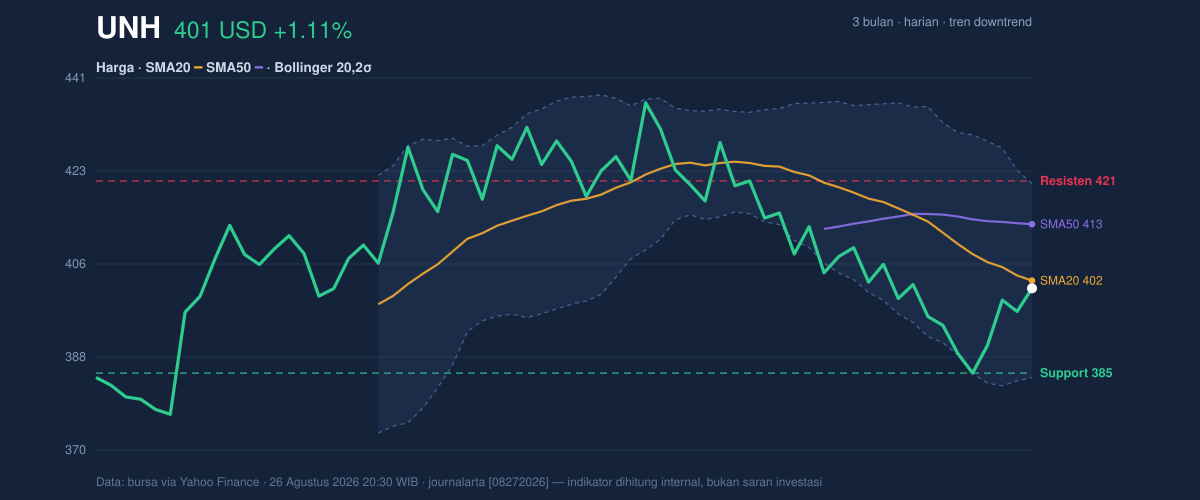
The stock is sitting at 44% of its 20-day range, with support at 384.85 and resistance at 421.47. That middle-of-the-range position is important: it suggests the market has not chosen a clear direction yet, but it is also not close enough to support to imply panic selling. The broader three-month range, 461.62 to 374.72, shows how much ground UNH has already given back from its earlier high. For a large defensive healthcare name, that kind of retracement often reflects pressure on sentiment rather than one isolated event.
Oscillators & Momentum
The momentum picture is mixed, but not encouraging enough to call a reversal confirmed. RSI at 47.7 is neutral, which means the stock is neither stretched on the upside nor washed out on the downside. That matters because neutral RSI often appears when price is trying to stabilize, but it does not by itself prove that sellers are done.
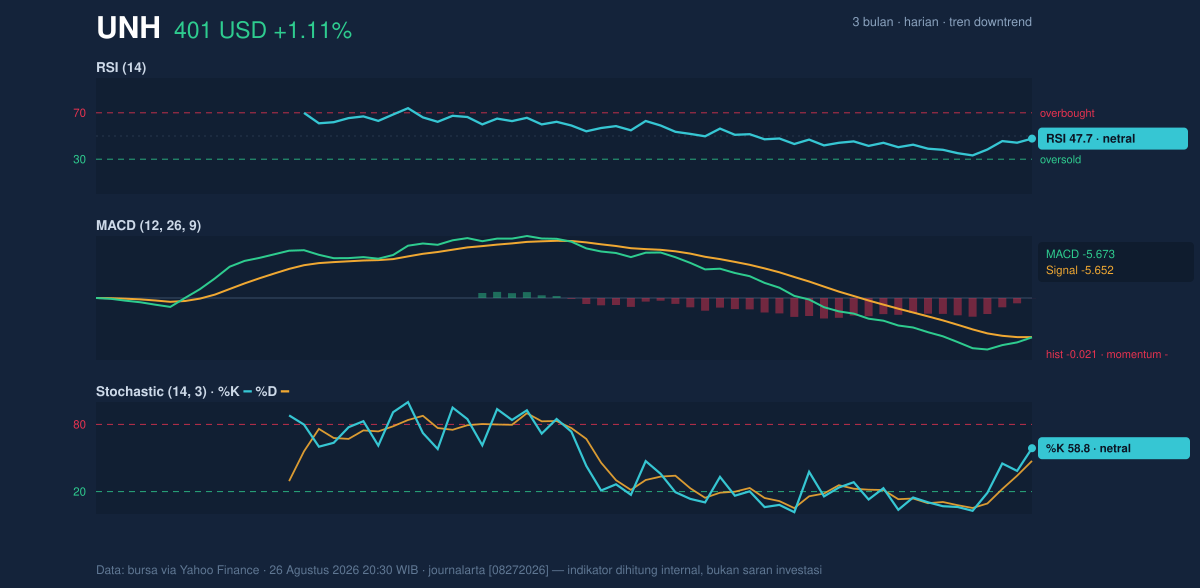
The stochastic reading, with %K at 58.8 and %D at 47.4, is also neutral and slightly firmer than RSI, hinting at a short-term bounce attempt. Yet the more important signal is MACD at -5.673, still just below its signal line at -5.652, with a negative histogram of -0.021. In plain English, MACD is saying upside momentum is still a little weaker than the trend baseline, so the recent lift has not yet overpowered the broader drift lower. That is why the chart reads more like a pause in the decline than a confirmed turn.
Volatility & Volume
Bollinger Bands add another layer to the story. UNH is trading near the middle band at 402.47, with the upper band at 420.97 and the lower band at 383.97. The %B at 46% says price is slightly below the midpoint of the band structure, which fits the idea of a stock trying to recover but not yet with enough force to challenge the upper boundary. The 9.2% band width is normal, so the stock is not in a volatility squeeze that would usually precede a sharp breakout; instead, it suggests movement is contained for now.
Volume also leans cautious. The latest turnover was 3,557,000, below the 20-day average of 4,111,895, or 0.9× normal. That means the bounce came on less participation than usual, which weakens the case that institutions are aggressively accumulating shares here. The OBV is down, and that matters because on-balance volume tracks whether trading activity is supporting price or quietly contradicting it. A falling OBV while price stabilizes often signals that rallies may be fragile until volume improves. ATR at 8.18, or 2.0% of price, points to moderate daily movement rather than a disorderly swing, so the stock can still move meaningfully without entering a stress regime.
Key Levels & Scenarios
The immediate technical map is straightforward. 384.85 is the first important support, and a failure there would reopen the lower end of the recent range near 374.72. On the upside, 421.47 is the first resistance to watch, closely aligned with the Bollinger upper band at 420.97. That clustering makes the low-420s a meaningful ceiling unless momentum improves.
If UNH can reclaim 402.47 and hold above it, the stock would be testing whether the bounce has enough strength to challenge resistance. If it fails to hold 384.85, the chart would shift back toward the lower part of the three-month range, where sellers have already shown they are willing to press the name. The key signal is not just whether price rises, but whether it does so with stronger participation and a better MACD profile.
Technical Verdict: HOLD (wait & see)
HOLD (wait & see)
- Price is below SMA20 at 402.47 and SMA50 at 413.22, so the stock remains under its main short- and medium-term trend markers.
- MACD is still negative and slightly below its signal line, which says momentum has not fully turned.
- Volume is 0.9× normal and OBV is down, so the rebound lacks strong confirmation from trading activity.
- Verdict invalidated if price breaks below 384.85, which would expose the lower range near 374.72.
- Ideal Entry Range: 384.85 to 402.47, where support and the 20-day average cluster.
- Exit Target: 420.97 to 421.47, where Bollinger resistance and chart resistance converge.
- Stop Loss protection: below 384.85, because a clean break there weakens the current base.
For non-traders, this means UNH is trying to steady itself, but the chart still needs stronger proof before the rebound can be trusted. The next important test is whether the shares can reclaim 402.47 and then confront 421.47.
Summary Data UNH
| Last price | 401.01 USD |
| Change 1 day / 5 days / 1 month | 1.11% / 3.19% / -4.65% |
| Trend / MA-cross | downtrend / none |
| SMA20 / SMA50 | 402.47 / 413.22 |
| RSI (14) / Stochastic %K | 47.7 / 58.8 |
| Bollinger %B / ATR | 46% / 8.18 |
| Support / Resistance 20 days | 384.85 / 421.47 |
| Data as of | 26 Agustus 2026 20:30 WIB |
Track UNH stock price daily: live levels, support/resistance and our full UNH analysis history.



