OCBC Stock Technicals Today: Gains 1.68%, Testing Key Resistance
On Agustus 27, 2026: price 31.44 SGD, trend uptrend, RSI 68.7, support 28.63, resistance 31.79. technical analysis of ocbc stock. OCBC Stock Technicals — full…
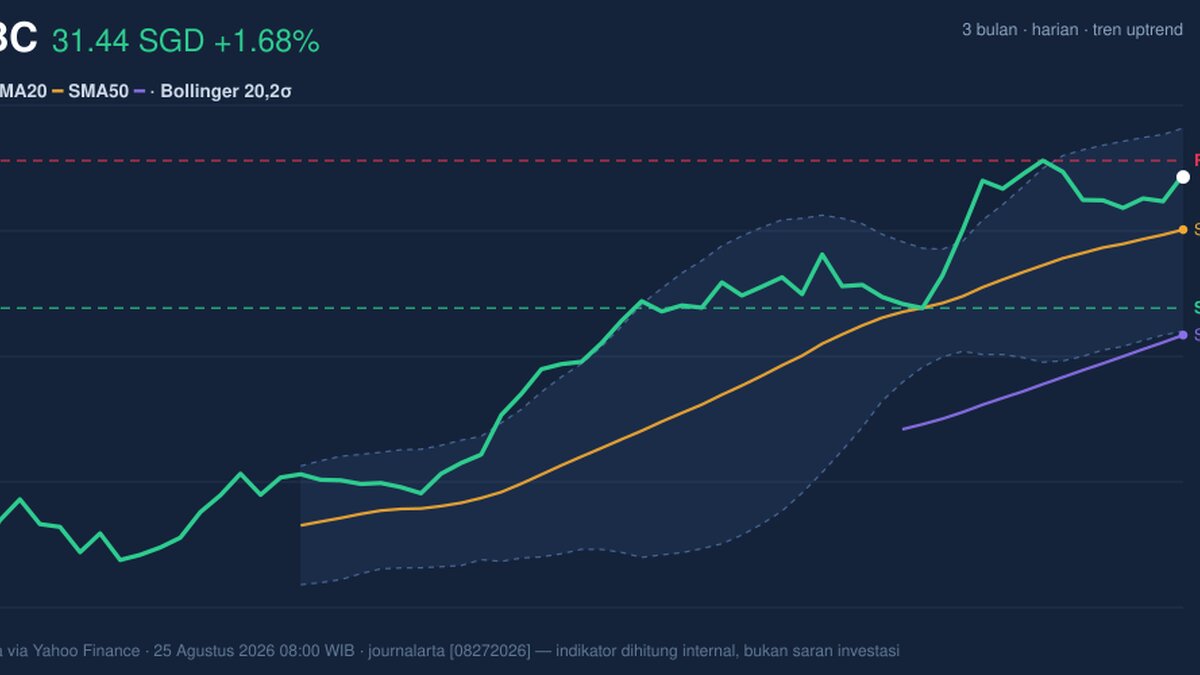
OCBC Bank’s shares on SGX rose to 31.44 SGD, up from a previous close of 30.92, leaving the counter near the top of its recent trading band and just below the latest resistance at 31.79. The move extends a one-month gain of 7.34% and keeps the stock in an established uptrend, but the chart is now showing the first signs that the pace of ascent may be cooling rather than accelerating.
Trend & Price Action
As shown in the chart, the price is trading above the SMA20 at 30.31 and well above the SMA50 at 28.05, which confirms that the medium-term structure remains constructive. A price above both moving averages usually means buyers have controlled the trend for long enough to pull the average cost of recent holders higher, and that often acts as a cushion on dips. The slope of the SMA20, at 1.68% over five days, reinforces that the trend is still pointing upward.
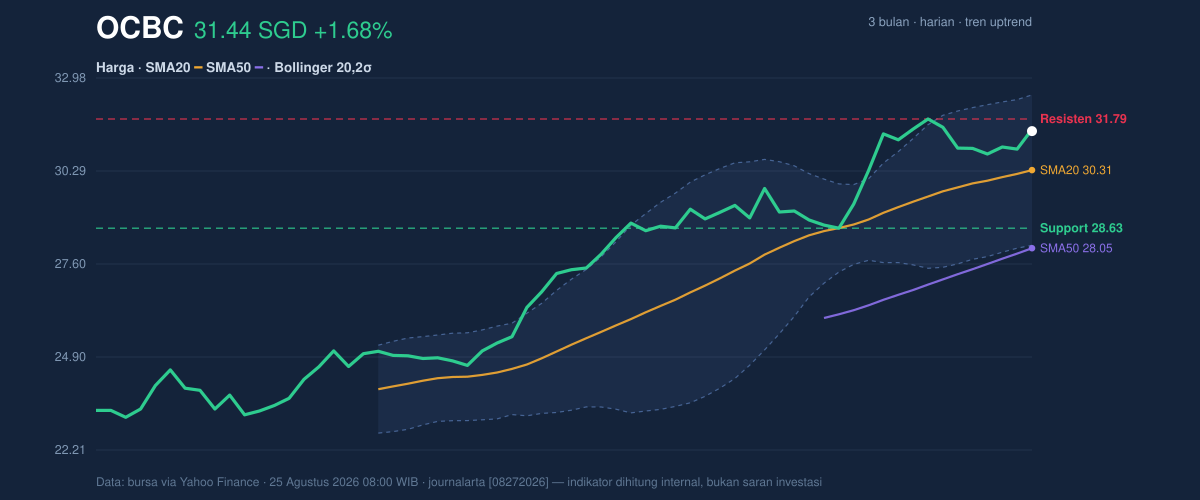
What matters now is where the stock sits inside the range. At 31.44, it is already in 89% of the 20-hour range and only a touch below resistance at 31.79, while the broader three-month high sits at 31.86. That positioning tells readers something important: the market is not pricing in a deep pullback yet, but it is also approaching an area where prior buying interest may have been largely absorbed. When a stock trades this close to its ceiling, fresh gains often require either stronger volume or a cleaner momentum reset.
The Bollinger Band structure supports that reading. The price is above the middle band at 30.31 and below the upper band at 32.49, with %B at 76%. In plain terms, the stock is trading in the upper part of its recent volatility envelope, but not at an extreme breakout level. The band width of 14.4% is described as normal, which means the market is not in a volatility squeeze that would typically precede a sharp expansion. Instead, the chart suggests a steady trend that may need a new catalyst to push decisively through resistance.
Oscillators & Momentum
The momentum picture is less uniform than the price trend. RSI at 68.7 sits near the upper end of the neutral zone and close to the common overbought threshold, which means the stock is strong but no longer cheap on short-term momentum measures. That does not by itself signal a reversal. It does, however, warn that the easy part of the move may already have happened.
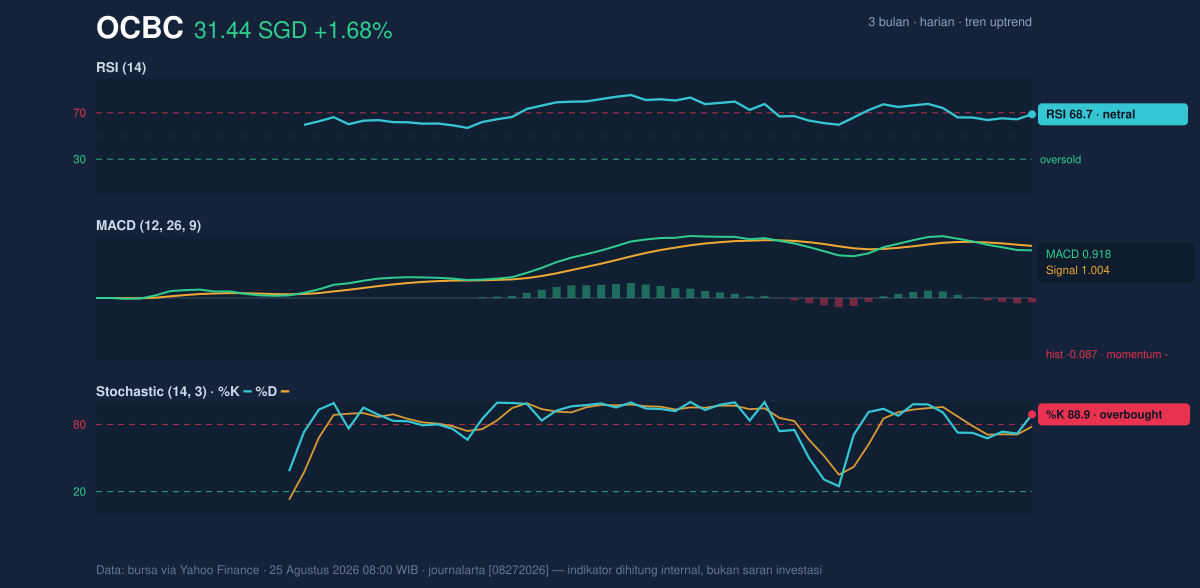
The more revealing signal comes from stochastic readings. Stochastic %K at 88.9 and %D at 78.1 are both in overbought territory, which often indicates that recent closes have been clustering near the top of the range. In a strong trend, that can persist for a while; in a tired trend, it can be the first hint of a pause. The key detail is that overbought does not mean “about to fall” on its own, but it does mean upside momentum is stretched.
MACD is the clearest caution flag. MACD at 0.918 remains positive, which means the broader trend is still upward, but it is below the signal line at 1.004, and the histogram at -0.087 shows momentum has turned negative in the near term. That combination matters because it says price can still be rising while the rate of rise is weakening underneath. In market terms, this is a classic “trend intact, thrust fading” setup.
Volatility & Volume
ATR(14) at 0.69, or 2.2% of price, points to moderate volatility. That means daily swings are present but not wild, so any break above resistance may need more than a single enthusiastic session to stick. The Bollinger band width being normal rather than compressed also suggests the stock is not coiled for an explosive move right away.
Volume is not helping the bullish case at the moment. The latest turnover of 6,188,800 is below the 20-session average of 7,056,729, or 0.9 times normal. That matters because breakouts are more convincing when they occur on expanding participation. Here, the market is advancing without fully convincing volume support, and OBV is falling, which means cumulative volume flow is diverging from the price trend. In simple language, the share price is climbing, but the underlying participation is not confirming the move as strongly as it should.
Key Levels & Scenarios
The nearest support is 28.63, with the Bollinger middle band at 30.31 acting as a more immediate technical reference. If the stock holds above that central band, the trend can remain orderly even if it pauses near the top of the range. If it fails to hold 30.31, the market would likely be signalling that the latest push has lost traction and that a deeper retracement toward 28.63 could follow.
On the upside, 31.79 is the first clear resistance, and 31.86 marks the three-month high. A clean move through both would be the strongest evidence that the current uptrend is resuming with conviction rather than simply stalling near resistance. Until that happens, the stock remains in a technically positive but increasingly stretched position.
Technical Verdict: HOLD (wait & see)
HOLD (wait & see)
- Trend remains positive: price is above SMA20 at 30.31 and SMA50 at 28.05, so the broader structure is still upward.
- Momentum is stretched: Stochastic %K 88.9 / %D 78.1 is overbought, while MACD histogram -0.087 shows short-term momentum is weakening.
- Participation is softer: volume is 0.9× normal and OBV is down, which makes the move above resistance less convincing.
- Verdict invalidated if price falls below 30.31, the Bollinger middle band and immediate trend reference.
- Ideal Entry Range: 30.31 to 30.50
- Exit Target: 31.79 to 31.86
- Stop Loss protection: below 28.63
For non-traders, this means the stock still looks healthy, but it is close enough to resistance and stretched enough in momentum that patience matters more than chasing strength.
Summary Data OCBC
| Last price | 31.44 SGD |
| Change 1 day / 5 days / 1 month | 1.68% / 1.58% / 7.34% |
| Trend / MA-cross | uptrend / none |
| SMA20 / SMA50 | 30.31 / 28.05 |
| RSI (14) / Stochastic %K | 68.7 / 88.9 |
| Bollinger %B / ATR | 76% / 0.69 |
| Support / Resistance 20 days | 28.63 / 31.79 |
| Data as of | 25 Agustus 2026 08:00 WIB |
Track OCBC share price daily: live levels, support/resistance and our full OCBC analysis history.



