QCOM Stock Gains 1.97%, Momentum Gains In Focus
On Agustus 27, 2026: price 163.72 USD, trend sideways, RSI 47.3, support 147.61, resistance 167.86. technical analysis of qcom stock. QCOM Stock Gains — full…
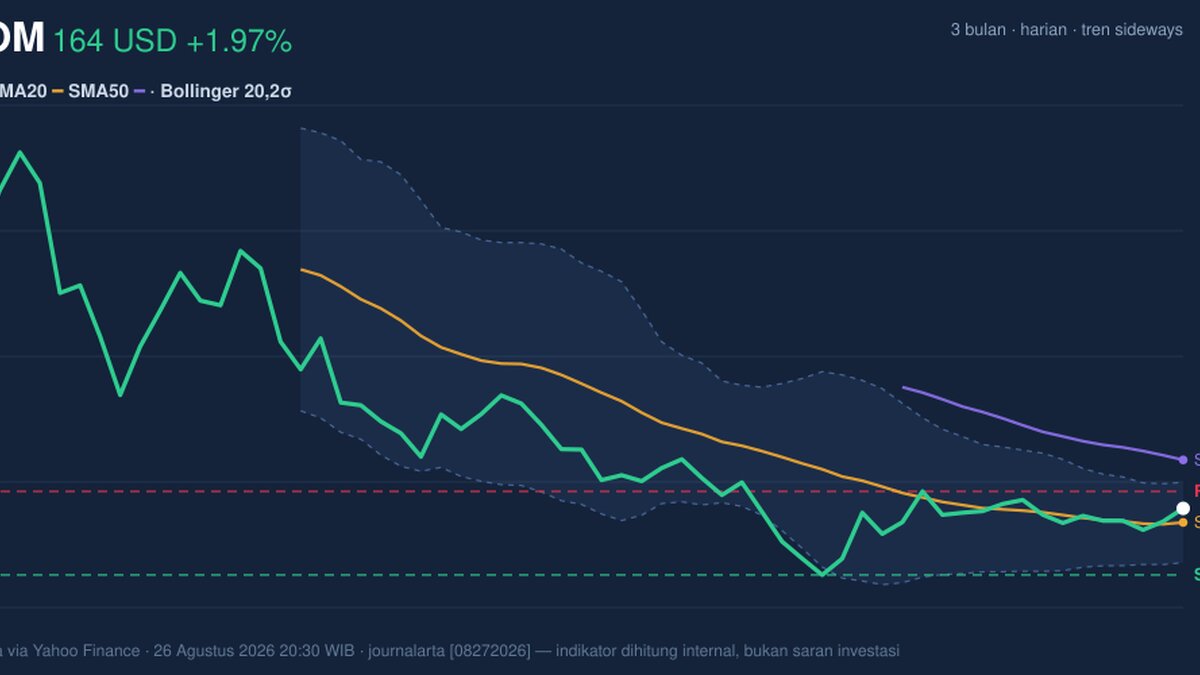
Qualcomm Inc. rose to 163.72 USD on NASDAQ on 26 August 2026, up 1.97% from the previous close of 160.56, as traders continued to price the stock inside a broad sideways pattern rather than a clean breakout. The move matters because the shares are now sitting above the short-term trend line, but still well below the longer-term average, which tells us the recent bounce is real but not yet decisive.
Trend & Price Action
The chart shows Qualcomm trading above its SMA20 at 160.32 but below its SMA50 at 175.47, a setup that usually signals a stock trying to stabilise after a weaker stretch rather than one in a confirmed uptrend. The absence of a new MA-cross means there is no fresh moving-average signal to anchor a directional call, and the sideways trend label fits the picture: price is recovering, but the slope of the SMA20 at -0.69% over 5 days says the short-term trend is still slightly soft.
That matters because price is not breaking away from the range; it is working through it.
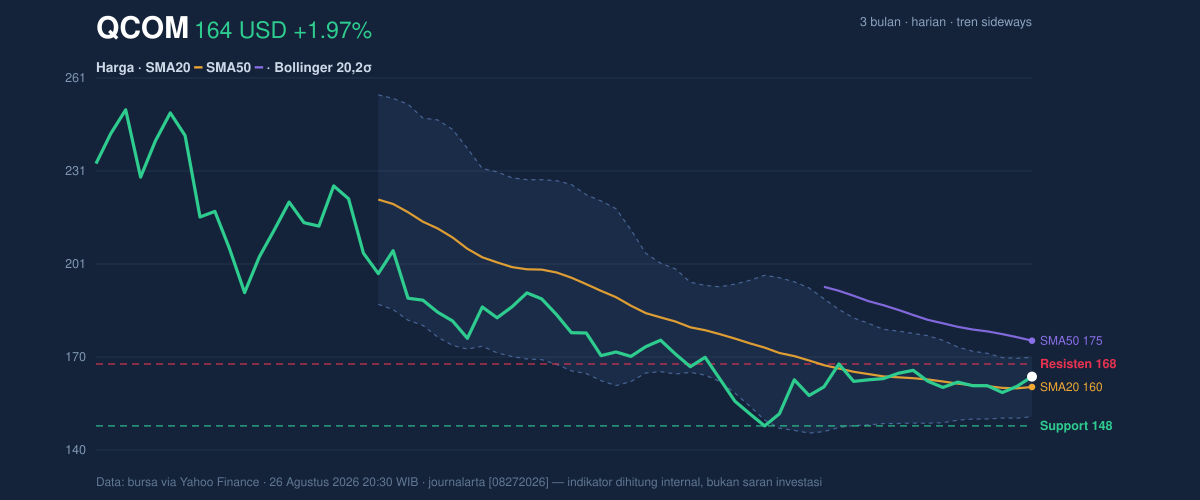
At 163.72, the stock is also near the upper part of its recent trading band, with support at 147.61 and resistance at 167.86. Being in the 80% zone of the 20-hour range suggests buyers have regained control of the intraday tape, but they have not yet forced a clean test of resistance. The broader context is still stark: the stock remains far below the 3-month high of 259.92 and above the 3-month low of 142.89, which is another way of saying the rebound has room to extend, but the market has not yet repaired the larger down move.
Oscillators & Momentum
Momentum is better than the trend, and that split is important. The RSI at 47.3 is neutral, which means Qualcomm is neither stretched nor oversold; it is simply in the middle of the road. The Stochastic %K at 59.3 and %D at 40.9 are also neutral, but with %K above %D, the short-term price impulse has turned more constructive. The key point is that these oscillators are not shouting “overbought,” so the stock still has technical headroom if buyers keep pressing.
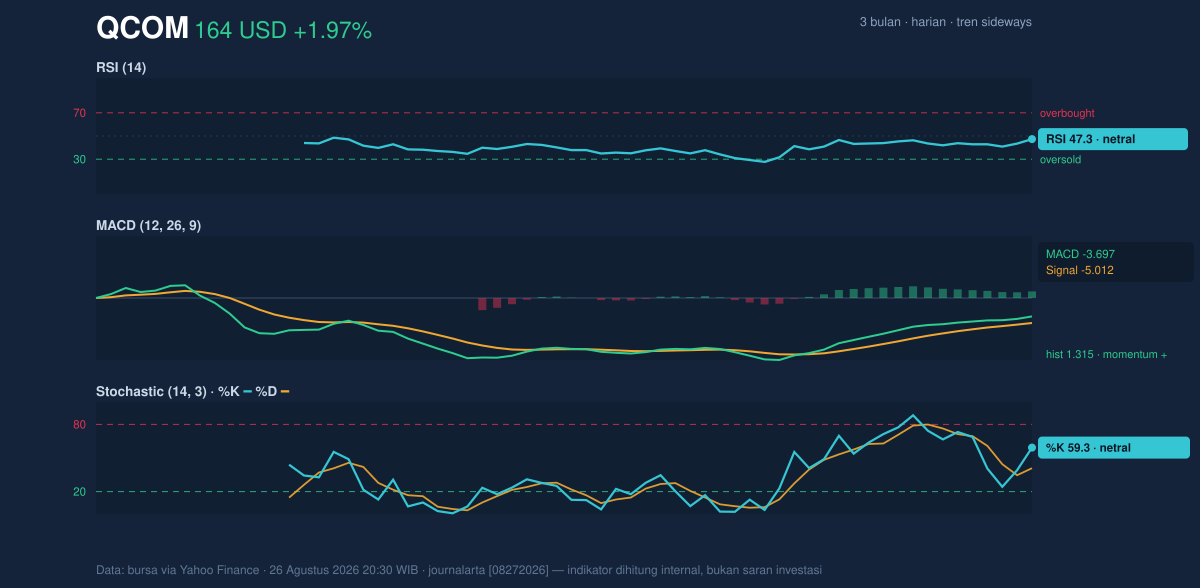
The most encouraging signal comes from the MACD at -3.697, which is still below zero, but the histogram at 1.315 shows momentum is improving. In plain English, the stock is not in a full bullish regime yet, but the pace of decline has eased enough to produce positive momentum divergence. That is often what a base-building phase looks like before a bigger move either way.
Volatility & Volume
Volatility is moderate, not explosive. The ATR(14) at 4.98, equal to about 3.0% of price, means daily swings are present but not chaotic. The Bollinger Bands are also telling a useful story: price is inside the channel, with the upper band at 170.03, the middle band at 160.32, and the lower band at 150.60. With %B at 68% and a normal 12.1% band width, the stock is leaning toward the upper half of its recent range, but the bands are not squeezing hard enough to imply an imminent volatility burst.
Volume supports the move, but only modestly. Last volume of 10,466,300 was essentially in line with the 20-hour average of 10,464,520, or 1.0x normal. That means the advance is not being driven by obvious panic or speculation; it is being accepted by the market without a dramatic surge in participation. The rising OBV is the better sign here, because it suggests accumulated buying pressure has been building even if headline volume has not spiked.
That is a healthier signal than a one-day burst.
Key Levels & Scenarios
The immediate technical battleground is clear. A move through 167.86 resistance would open the way toward the 170.03 Bollinger upper band, which is the first visible ceiling on the chart. If the stock fails to hold above 160.32, the middle Bollinger band and SMA20, the rebound loses credibility and the price would likely drift back toward 150.60, where the lower band sits and where buyers would need to defend the structure.
The broader range still matters because it frames the swing. Qualcomm is trading well above the 147.61 support, so the market is not in immediate danger of revisiting the lower boundary, but it is also not yet strong enough to claim a trend reversal. As shown in the chart, the stock is positioned in the upper half of the range, which usually favours a continued test of resistance before any larger decision is made.
Technical Verdict: HOLD (wait & see)
HOLD (wait & see) fits best because the stock is improving, but the evidence is mixed: price is above the SMA20 yet still below the SMA50, MACD momentum is positive but still below zero, and RSI/Stochastic are neutral rather than strongly directional.
- Ideal entry range: 160.32 to 163.72, where price is sitting near the SMA20 and middle Bollinger band support.
- Exit target: 167.86 to 170.03, using the 20-hour resistance and upper Bollinger band as the first technical ceiling.
- Stop loss protection: below 150.60, where the lower Bollinger band sits and where a failed rebound would start to look structurally weak.
- Verdict invalidated if price breaks below 147.61, the 20-hour support.
For non-traders, this means Qualcomm is recovering, but the chart has not yet proven that the recovery is strong enough to call it a trend change.
The latest 20-hour support level is 147.61 USD.
Summary Data QCOM
| Last price | 163.72 USD |
| Change 1 day / 5 days / 1 month | 1.97% / 1.12% / 5.16% |
| Trend / MA-cross | sideways / none |
| SMA20 / SMA50 | 160.32 / 175.47 |
| RSI (14) / Stochastic %K | 47.3 / 59.3 |
| Bollinger %B / ATR | 68% / 4.98 |
| Support / Resistance 20 days | 147.61 / 167.86 |
| Data as of | 26 Agustus 2026 20:30 WIB |
Track QCOM stock price daily: live levels, support/resistance and our full QCOM analysis history.



