SBUX Stock Gains 2.58%, Testing Key Resistance In Focus
On Agustus 27, 2026: price 108.49 USD, trend uptrend, RSI 57.6, support 103.37, resistance 108.55. technical analysis of sbux stock. SBUX Stock Gains — full…
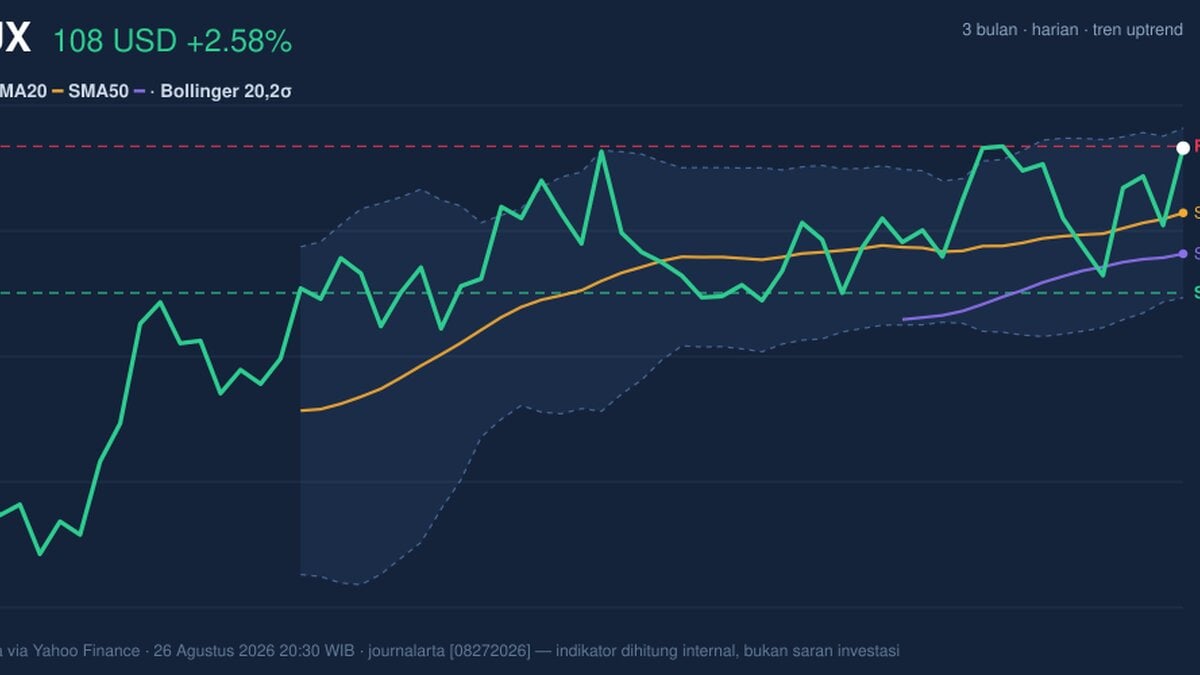
Starbucks Corp. rose on the NASDAQ to 108.49 USD on 26 August 2026, a move that put the stock almost exactly at the top of its short-term trading band. It is a small but important signal. The shares are now pressing against nearby resistance while still holding above the key short-term averages, a setup that often tells traders the market is testing whether the recent advance has enough force to continue.
Trend & Price Action
The broader message from the chart is constructive. Starbucks is in an uptrend, with the SMA20 at 106.20 rising at 0.73% over 5 days, and the stock trading above the SMA20 as well as the SMA50 at 104.75. That matters because price above both moving averages usually means buyers have regained short- and medium-term control, even if the move is not yet dramatic.
There is no new MA-cross, which means this is not a fresh trend signal from the moving averages themselves. Instead, the current strength is being carried by price holding above the averages and staying near the upper end of its recent range. As shown in the chart, the stock is trading at 99% of its 20-hour range, with support at 103.37 and resistance at 108.55. That placement is important: when a stock sits this close to resistance, the market is effectively asking whether the prior buyers are still willing to pay up.
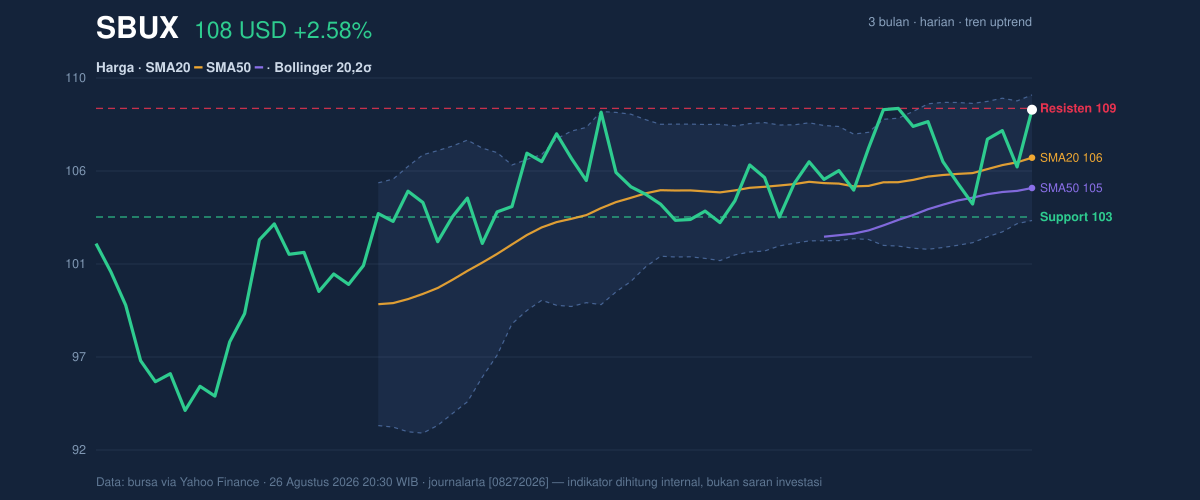
The broader range also gives the move context. The 3-month high is 110.51 and the 3-month low is 93.64, so Starbucks is trading near the upper end of that span rather than in the middle. That usually indicates the market has improved its view of the name, but it also means upside attempts may meet supply from traders who bought lower and may be tempted to lock in gains.
Oscillators & Momentum
Momentum is positive, but not stretched enough to suggest an extreme move. The RSI(14) at 57.6 sits in neutral territory, which means the stock is not overbought and still has room to extend if buyers keep showing up. The Stochastic %K at 73.2 and %D at 56.7 also point to a firm but not overheated tone. In plain English, the stock is leaning upward, but the momentum gauges are not flashing the kind of excess that often appears right before a sharp reversal.
The MACD at 0.695, above its signal line at 0.680, with a positive histogram of 0.014, is the cleaner confirmation in the set. MACD is a trend-following momentum measure, and when it sits above the signal line it usually means the shorter-term trend is still outperforming the longer-term trend. The histogram being positive, even if only slightly, suggests that the improvement is still intact rather than fading.
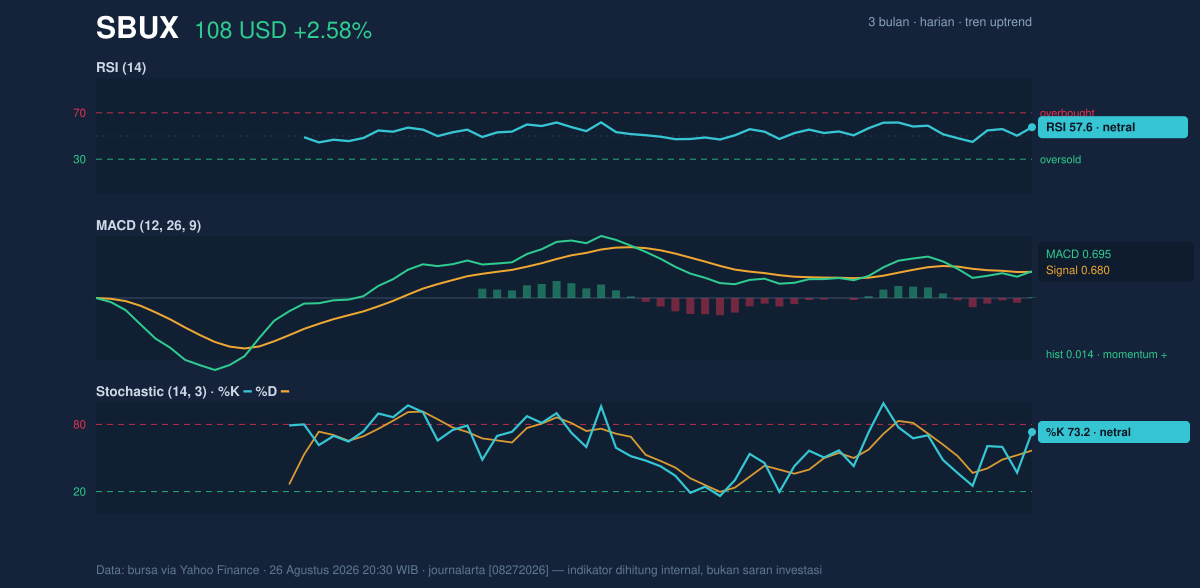
The key nuance is that momentum is supportive, but not explosive. That makes the current move more believable than euphoric. It also means the next decisive signal is likely to come from price behavior around resistance rather than from the oscillators alone.
Volatility & Volume
Volatility is moderate. The ATR(14) is 2.63, or 2.4% of price, which tells readers the stock is moving enough to matter but not in a disorderly way. ATR measures the typical daily range, so this reading implies Starbucks can still travel meaningfully in either direction without implying panic. That is especially relevant because the Bollinger Bands are now narrowing, with the band width at 5.6%. A squeeze in Bollinger Bands often signals that the market has become quieter and may be preparing for a larger move once price chooses a direction.
The position inside those bands is also telling. The stock is near the top, with %B at 88% and the upper band at 109.19. That means price is hugging the upper edge of the recent volatility envelope, which is consistent with strength. But because the bands are tight, the market is also in a coiled state; a break above the upper band could attract follow-through, while failure near the top could quickly send price back toward the middle band at 106.20.
Volume, however, is not fully confirming the move. Last volume was 6,049,100, below the 20-day average of 7,343,060, or about 0.8x normal. That matters because a rise on lighter volume can still be real, but it is less convincing than a rise backed by broad participation. The one offset is that OBV is rising, which suggests accumulated buying pressure has been building over time even if the latest session was not especially busy. In other words, the market is not seeing a panic chase higher; it is seeing steady accumulation.
Key Levels & Scenarios
The immediate battleground is tight. Resistance at 108.55 sits just above the last price of 108.49, while the nearest meaningful floor is support at 103.37. Because the stock is already at the upper edge of the range, a clean push through resistance would likely be interpreted as a continuation signal, especially with the Bollinger upper band at 109.19 and the 3-month high at 110.51 acting as the next reference points.
If price clears 108.55 and holds above it, the chart suggests the squeeze in volatility could resolve upward. If it fails there, the more likely reaction is a drift back toward the SMA20 at 106.20, which now acts as the first technical pivot. A deeper loss of that level would weaken the short-term structure and bring 103.37 into focus.
Technical Verdict: HOLD (wait & see)
HOLD (wait & see)
- Reason 1: Price is above the SMA20 and SMA50, which keeps the trend constructive.
- Reason 2: MACD is positive and above its signal line, showing momentum is still supportive.
- Reason 3: Bollinger Bands are squeezing, which raises the odds of a directional move, but not yet its direction.
- Verdict invalidated if price falls below 103.37, the nearest support from the 20-hour range.
- Ideal entry range: 106.20 to 108.55
- Exit target: 109.19 to 110.51
- Stop loss protection: below 103.37, with the SMA50 at 104.75 as an earlier warning zone
For non-traders: Starbucks is still technically firm, but the stock is sitting right at a decision point, so the chart is asking for confirmation before the next move.
The latest 3-month high is 110.51.
Summary Data SBUX
| Last price | 108.49 USD |
| Change 1 day / 5 days / 1 month | 2.58% / 3.34% / 4.18% |
| Trend / MA-cross | uptrend / none |
| SMA20 / SMA50 | 106.20 / 104.75 |
| RSI (14) / Stochastic %K | 57.6 / 73.2 |
| Bollinger %B / ATR | 88% / 2.63 |
| Support / Resistance 20 days | 103.37 / 108.55 |
| Data as of | 26 Agustus 2026 20:30 WIB |
Track SBUX stock price daily: live levels, support/resistance and our full SBUX analysis history.



