Shell Momentum Weakens: Stock Drops 0.77% (Agustus 27, 2026)
On Agustus 27, 2026: price 3,371.00 GBp, trend uptrend, RSI 58.4, support 3,277.50, resistance 3,440.00. technical analysis of shell stock.
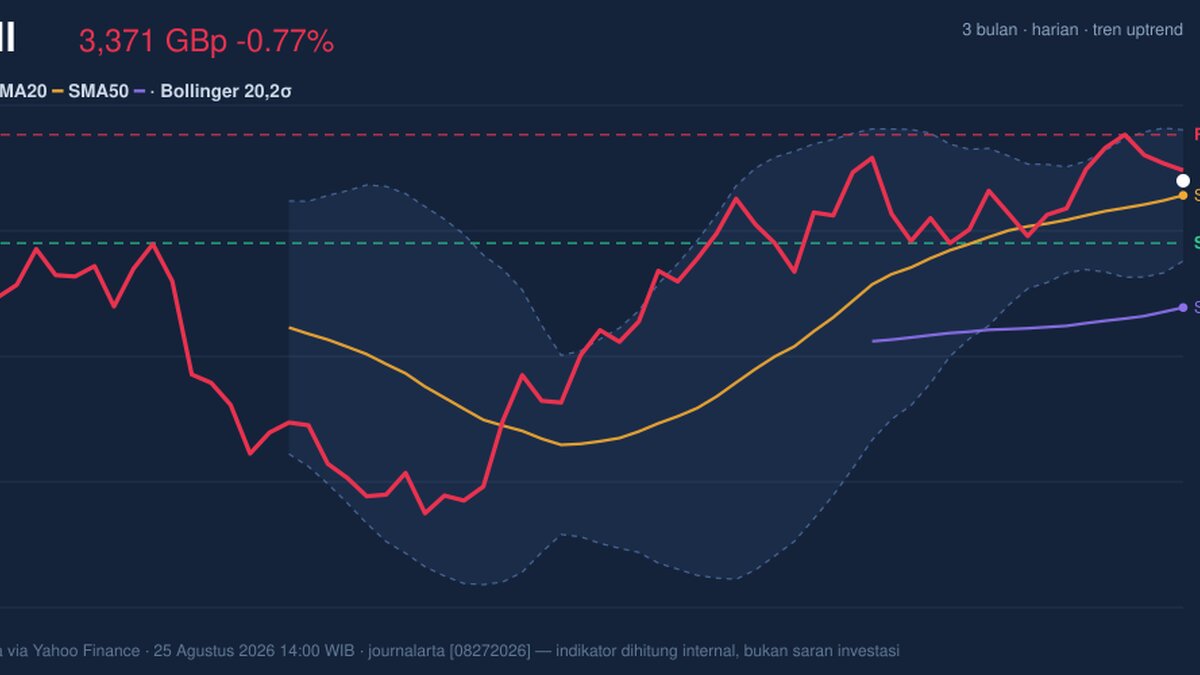
Shell plc edged lower on the London Stock Exchange on 25 August 2026, with the shares last changing hands at 3,371.00 GBp after a 0.77% daily decline, even as the broader chart still points to an uptrend. The message from the tape is not one of outright weakness, but of a market that is climbing with caution: price remains above the short- and medium-term averages, yet momentum indicators are no longer fully supportive, and volume flow is sending a mixed signal.
Trend & Price Action
Shell’s price is still trading above its SMA20 at 3,349.08 and well above its SMA50 at 3,180.85, which is the clearest sign that the medium-term structure remains constructive. In plain terms, the shares are holding above the levels traders often use to judge whether a rally is intact. The uptrend is also backed by the 0.90%/5-day slope in SMA20, suggesting recent price action has been leaning upward rather than rolling over.
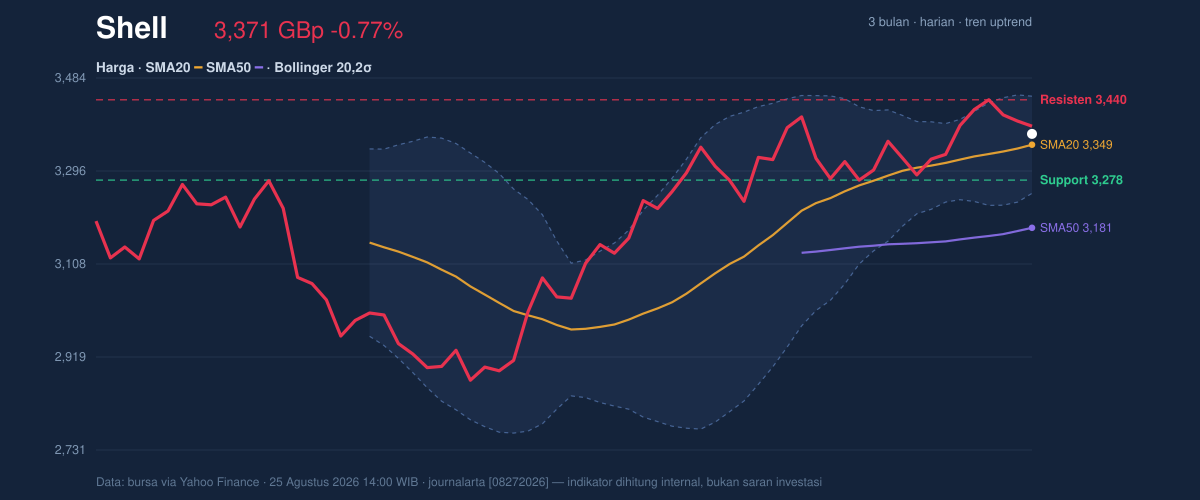
What matters, though, is where price sits inside the current range. At 58% of the 20-hour range, Shell is not pressing the top band, but it is also not near the floor. The stock is trading below the 20-hour resistance at 3,440.00 and above the 20-hour support at 3,277.50, which leaves it in the middle of a band that can resolve either way. The position is important because it tells us the market has not yet committed to a breakout, even though the longer trend remains positive.
The Bollinger setup reinforces that reading. Price is sitting below the upper band at 3,447.29 and above the middle band at 3,349.08, with %B at 61%, meaning the shares are trading in the upper half of the envelope but not stretched to an extreme. More notably, the 5.9% Bollinger width shows the bands are narrowing, a squeeze that often precedes a sharper move. A squeeze does not predict direction on its own; it simply warns that the market is storing energy.
Oscillators & Momentum
Momentum is less decisive than trend. The RSI at 58.4 is neutral-to-firm, which says the stock has room to move without looking overbought, but it is not flashing strong upside acceleration either. The Stochastic %K at 64.8 and %D at 70.2 also sit in neutral territory, though the %K below %D hints that short-term enthusiasm has eased a little.
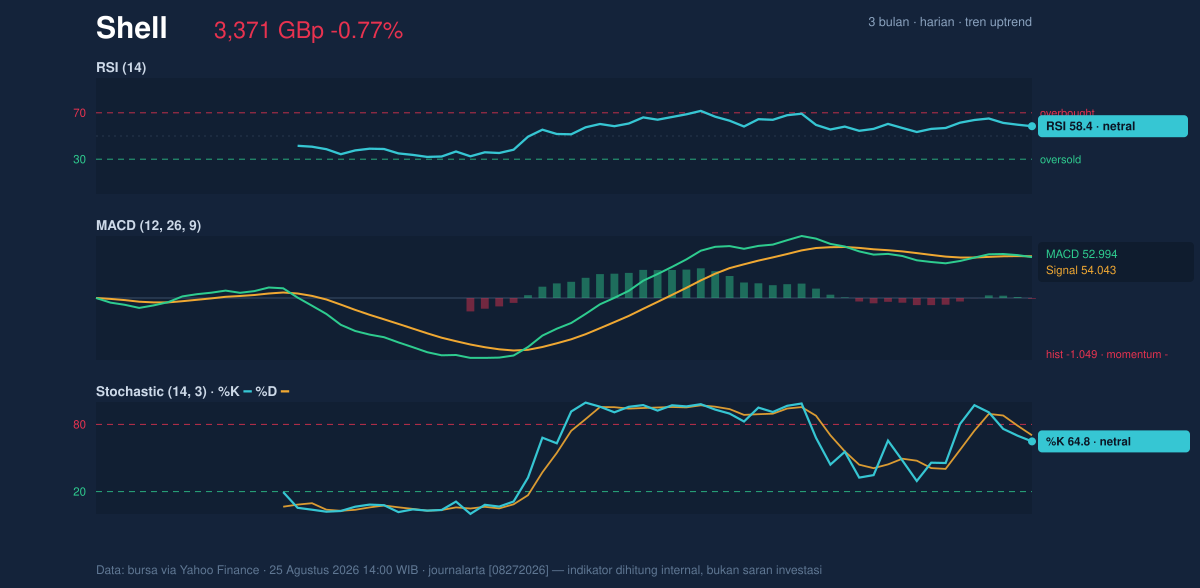
The more cautionary signal comes from MACD. Shell’s MACD at 52.994 is below the signal line at 54.043, and the -1.049 histogram shows momentum is negative in the near term. That does not overturn the broader uptrend, but it does explain why the shares are struggling to extend higher despite trading above the key moving averages. In practical terms, the trend is still up, but the pace of advance has slowed enough that traders are waiting for confirmation rather than chasing strength.
Volatility & Volume
Volatility is moderate, not explosive. The ATR(14) at 51.23, equal to 1.5% of price, suggests daily movement is present but not unusually wide. Combined with the Bollinger squeeze, that points to a market that could soon choose a direction, but has not yet done so.
Volume is more revealing. The latest print of 19,189,592 shares is about 2.0× the 20-hour average of 9,565,058, which means the move is being met with serious participation. That is usually constructive when a stock is breaking higher, but less so when price is slipping and the OBV is falling. OBV, or on-balance volume, tracks whether volume is flowing into the stock or out of it; a decline here suggests the heavier trading has not been enough to establish net accumulation. In other words, the market is active, but not clearly buying into the move.
Shell is also still below its 3-month high of 3,758.50 and comfortably above the 3-month low of 2,559.50, so the longer range still leaves room for recovery if resistance gives way.
Key Levels & Scenarios
The immediate line in the sand is the 3,277.50 support. If that level holds, the current uptrend can remain intact and the stock can keep probing the 3,440.00 resistance. A clean move through that resistance would matter because it would put price near the upper Bollinger band at 3,447.29, where a squeeze-driven expansion could gather pace.
If Shell fails to hold 3,277.50, the near-term structure weakens and the market would be more likely to revisit the SMA20 at 3,349.08 from below, with the broader trend then depending on whether buyers defend the SMA50 at 3,180.85. The current setup therefore reads as a constructive base with a momentum warning attached, not as a clean breakout.
Technical Verdict: HOLD (wait & see)
HOLD (wait & see)
- RSI at 58.4 and Stochastic at 64.8/70.2 are neutral, so momentum is not strong enough to confirm an immediate breakout.
- MACD is below the signal line and the -1.049 histogram shows near-term momentum is negative, even though the broader trend remains up.
- The Bollinger squeeze and 2.0× volume surge suggest a move may be building, but OBV is falling, so participation is not yet clearly supportive.
- Verdict invalidated if price breaks below 3,277.50.
- Ideal entry range: 3,277.50 to 3,349.08
- Exit target: 3,440.00 to 3,447.29
- Stop loss protection: below 3,250.86
For non-traders, this means Shell is still in an uptrend, but the chart is asking for proof before the next leg higher.
“The market is active, but it has not yet shown its hand.”
Summary Data Shell
| Last price | 3,371.00 GBp |
| Change 1 day / 5 days / 1 month | -0.77% / -0.50% / 4.22% |
| Trend / MA-cross | uptrend / none |
| SMA20 / SMA50 | 3,349.08 / 3,180.85 |
| RSI (14) / Stochastic %K | 58.4 / 64.8 |
| Bollinger %B / ATR | 61% / 51.23 |
| Support / Resistance 20 days | 3,277.50 / 3,440.00 |
| Data as of | 25 Agustus 2026 14:00 WIB |
Track Shell share price daily: live levels, support/resistance and our full Shell analysis history.



