Singtel Momentum Gains: Stock Gains 2.04% (Agustus 27, 2026)
On Agustus 27, 2026: price 4.51 SGD, trend sideways, RSI 56.6, support 4.25, resistance 4.61. technical analysis of singtel stock. Singtel Momentum Gains —…
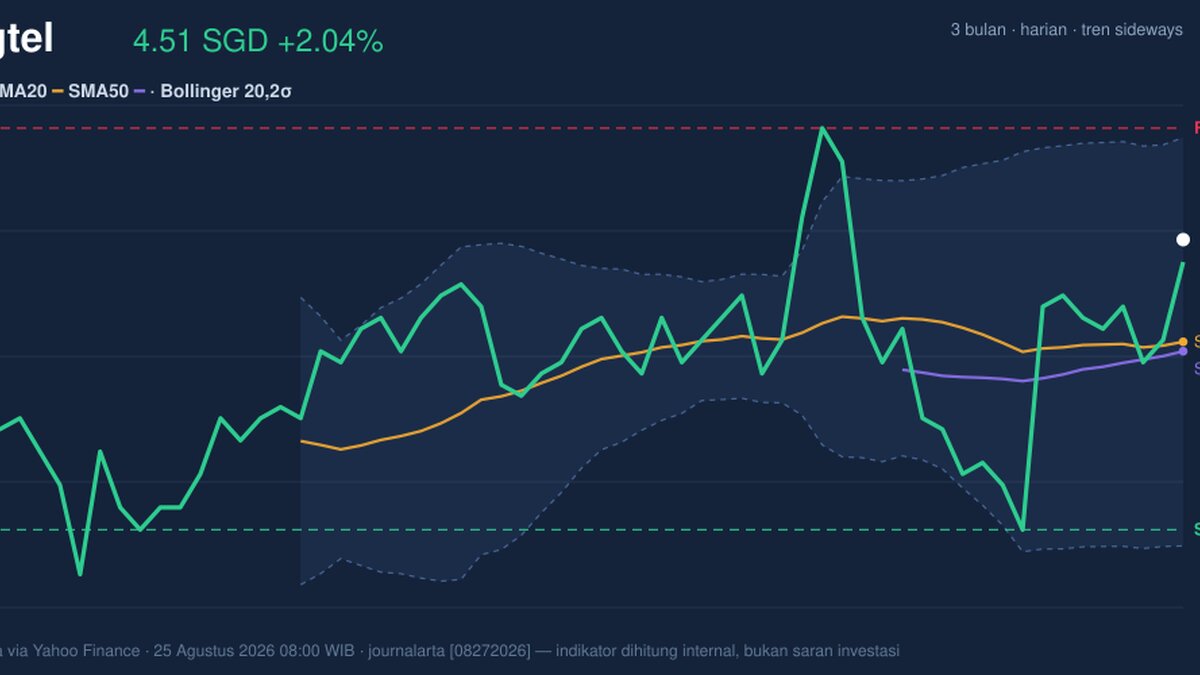
Singapore Telecom shares rose to SGD 4.51 on SGX by 25 August 2026, 08:00 WIB, up from the previous close of SGD 4.42, as the stock continued to trade in a sideways pattern but held above its short-term moving averages. The move matters because it shows the market is still willing to pay a little more for Singtel even though participation is not especially strong, and that combination often signals a market that is improving without yet breaking into a decisive trend.
Trend & Price Action
As shown in the chart, Singtel is sitting just above both its SMA20 at SGD 4.42 and SMA50 at SGD 4.41, which keeps the near-term structure constructive. The key point is not just that price is above the averages, but that the gap is small: this is a market leaning upward rather than accelerating upward.
The stock is still classified as sideways, with the SMA20 slope at 0.07% over 5 days. That tells investors the trend is not yet strong enough to call a fresh breakout phase. Instead, the shares are grinding higher inside a range, and that often means the market needs either stronger volume or a cleaner catalyst before it can leave the current band.
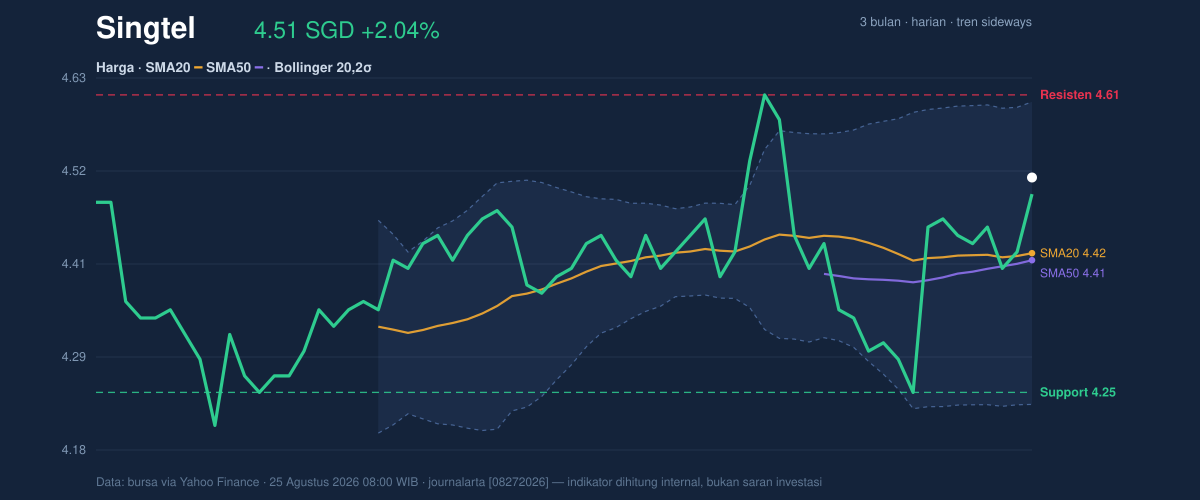
The broader range gives that reading more context. Singtel is trading at 72% of its 20-hour range, with support at SGD 4.25 and resistance at SGD 4.61. It is also below the 3-month high of SGD 4.70 but comfortably above the 3-month low of SGD 4.15. In plain terms, the stock is nearer the upper half of its recent trading corridor, but it has not yet proven that it can sustain a move through the upper boundary.
Oscillators & Momentum
The momentum picture is mixed, and that is the most important signal in the chart. RSI at 56.6 is neutral, which means the stock is not stretched and does not look technically exhausted. That is usually a healthy reading for a stock trying to build a base, because it leaves room for further gains without immediately triggering overbought concerns.
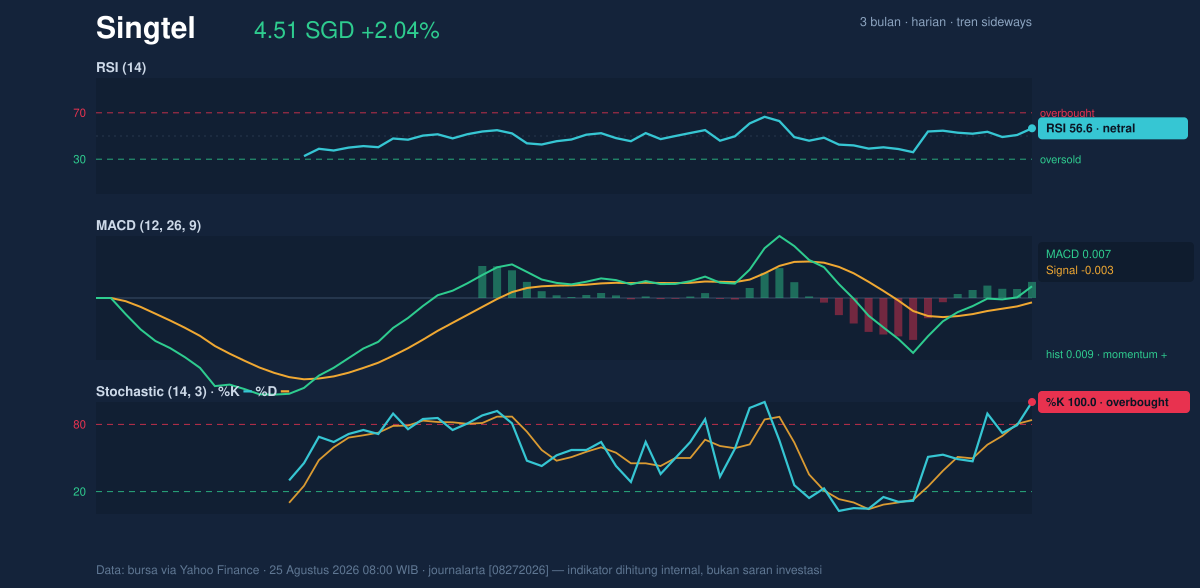
The caution comes from the stochastic oscillator, where %K is 100.0 and %D is 83.9. That is an overbought reading, and it means the latest push has been fast enough to leave the stock vulnerable to a pause or a small pullback. Overbought does not automatically mean a reversal, but it does mean the stock is moving near the top of its short-term range and may need to cool before extending higher.
The stronger part of the momentum setup is the MACD. MACD at 0.007, above the signal line at -0.003, with a histogram of 0.009, indicates positive momentum. In practical terms, the trend engine underneath the stock is improving even if the move has not yet broadened out. That combination — neutral RSI, overbought stochastic, positive MACD — usually points to an advance that is intact but not fully confirmed.
Volatility & Volume
Volatility is moderate rather than dramatic. ATR at 0.08, or 1.8% of price, suggests the stock is capable of moving, but not in a disorderly way. The Bollinger Bands reinforce that view: the upper band is at SGD 4.60, the middle band at SGD 4.42, and the lower band at SGD 4.24, with %B at 75% and a band width of 8.3%. That means price is trading in the upper portion of the band, but the bands themselves are not especially tight, so this is not yet a classic volatility squeeze that would usually precede a sharp breakout.
The volume data is the main brake on enthusiasm. Latest volume was 22,636,300, below the 20-session average of 30,766,384, or about 0.7x normal. That matters because price gains backed by weak turnover are less convincing than gains supported by broad participation. The OBV is falling, which suggests buying interest has not fully confirmed the recent price strength. Put simply, the stock is rising, but the crowd is not yet following with conviction.
Key Levels & Scenarios
The immediate map is clear. SGD 4.61 is the first resistance to watch, and it lines up closely with the upper Bollinger band at SGD 4.60. If the stock can move through that zone, it would signal that the recent range is being tested from above rather than simply revisited.
On the downside, SGD 4.25 is the nearest support. A slip back toward that level would suggest the current advance is losing traction and that the market is reverting toward the lower part of its range. Below that, the 3-month low of SGD 4.15 becomes the next important reference, because a break there would undo the recent improvement in structure.
The most useful interpretation is conditional: if price holds above the moving averages and keeps pressing toward SGD 4.61, the chart remains constructive; if it loses SGD 4.25, the case for near-term strength weakens quickly.
Technical Verdict: HOLD (wait & see)
HOLD (wait & see)
- MACD is positive, showing the underlying impulse is still improving.
- Price is above SMA20 and SMA50, which keeps the short-term structure intact.
- Stochastic is overbought and OBV is falling, so the recent rise lacks full confirmation.
Verdict invalidated if price breaks below SGD 4.25.
- Ideal Entry Range: SGD 4.42 to SGD 4.51
- Exit Target: SGD 4.60 to SGD 4.61
- Stop Loss protection: below SGD 4.25
For non-traders, this means the stock is improving, but it has not yet shown enough force to call the move fully convincing.
Summary Data Singtel
| Last price | 4.51 SGD |
| Change 1 day / 5 days / 1 month | 2.04% / 1.58% / 2.04% |
| Trend / MA-cross | sideways / none |
| SMA20 / SMA50 | 4.42 / 4.41 |
| RSI (14) / Stochastic %K | 56.6 / 100.0 |
| Bollinger %B / ATR | 75% / 0.08 |
| Support / Resistance 20 days | 4.25 / 4.61 |
| Data as of | 25 Agustus 2026 08:00 WIB |
Track Singtel share price daily: live levels, support/resistance and our full Singtel analysis history.



