On Agustus 27, 2026: price 25.87 USD, trend uptrend, RSI 71.8, support 23.06, resistance 25.87. technical analysis of t stock. Stock Analysis — full details…
By Alistair Sterling
August 27, 20265 min read
T Stock Analysis
AT&T closed at $25.87, up 0.39% on the day and already 8.06% higher over one month, as the stock pushed to the top of its recent range on the NYSE. The move is constructive, but it is also getting stretched: the chart shows a share price pressing against resistance while momentum gauges are flashing overbought.
Trend & Price Action
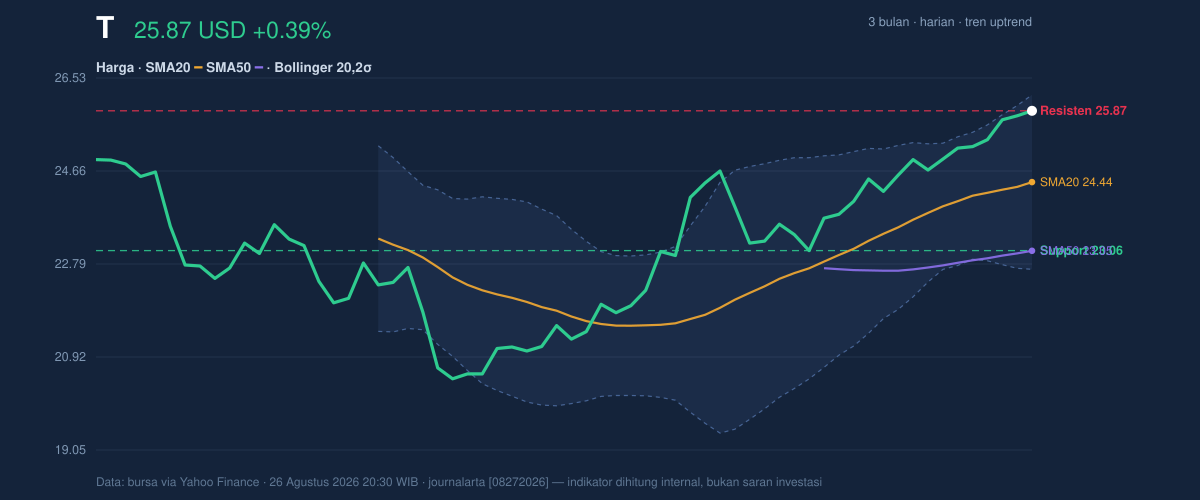
AT&T’s structure remains firmly upward. The stock is trading above its 20-day simple moving average at $24.44 and well above the 50-day average at $23.05, which tells traders that the shorter-term trend is still leading the longer one. In plain terms, that usually means recent buyers have been willing to pay up, and the market has not yet shown the sort of sustained weakness that would suggest a trend failure.
The slope of the SMA20, up 1.59% over five days, reinforces that message. A rising short-term average often acts like a moving floor beneath the price, and here it shows that the stock has been advancing fast enough to keep momentum intact. There is no fresh MA-cross, so this is not a new breakout signal from the moving averages themselves; it is more of a continuation phase, where the market is extending an existing trend rather than starting one.
3-month price action chart of T: price, SMA20/50, Bollinger, support & resistance. Data: exchange via Yahoo Finance.
The key detail is where price sits in the range. AT&T is at the 100% end of its 20-hour range, with support at $23.06 and resistance at $25.87. That means the stock is not merely near resistance — it is effectively sitting on it. The broader three-month range, from $19.89 to $26.02, shows how close the shares are to the upper boundary of the recent trading envelope. That matters because stocks often slow down, consolidate, or reverse when they approach prior highs unless volume and momentum are strong enough to force a clean break.
Oscillators & Momentum
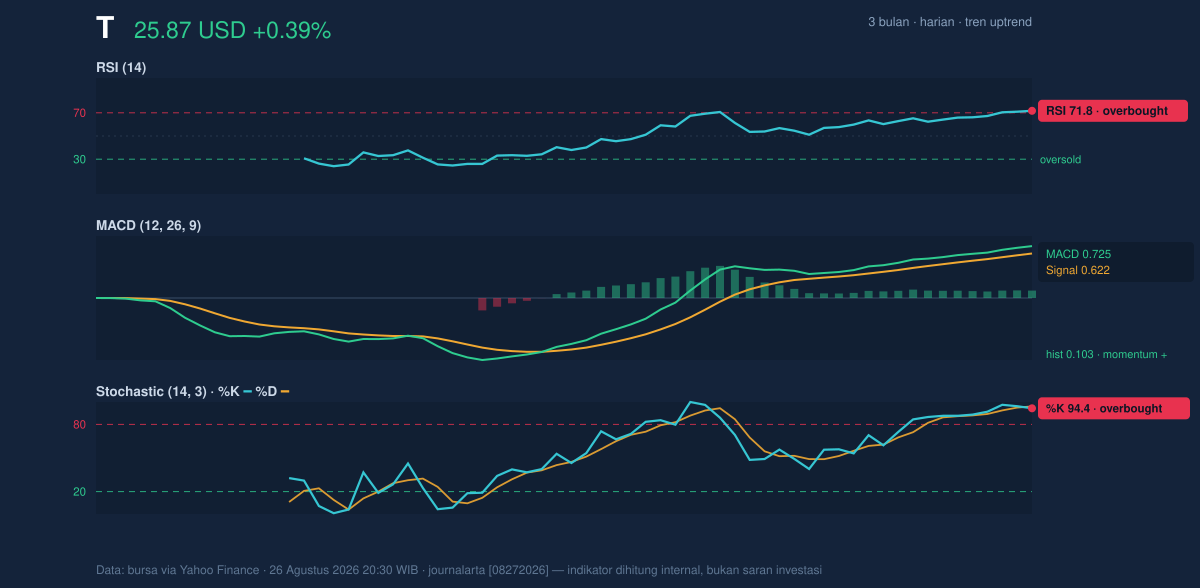
The momentum picture is where the story becomes more cautious. RSI at 71.8 and Stochastic %K at 94.4 versus %D at 96.0 both sit in overbought territory. For general readers, overbought does not mean “must fall”; it means the stock has risen quickly enough that it may be vulnerable to a pause or pullback as short-term traders take profits. The fact that both oscillators are elevated at the same time makes the move look mature rather than fresh.
Momentum chart of T: RSI(14), MACD, Stochastic. Data: exchange via Yahoo Finance.
That said, momentum is not turning negative yet. The MACD is 0.725, above its signal line at 0.622, with a positive histogram of 0.103. This combination indicates that upward momentum still exceeds downward pressure. In practical terms, MACD is saying the trend remains alive even if the oscillators are warning that the stock may be running hot. When RSI and Stochastic are overbought but MACD is still positive, the usual signal is not immediate reversal — it is that the stock may need time to digest gains before any further advance.
Volatility & Volume
Bollinger Bands help show how extended the move has become. AT&T is trading near the upper band, with %B at 91%, while the band width is 14.4%, described here as normal. A high %B means price is spending most of its time near the top of the band; that is often a sign of strength, but it also leaves less room before a mean-reversion move back toward the middle band at $24.44. In other words, the chart is not showing a volatility squeeze that might precede a dramatic expansion; it is showing a stock already near the top of a normal channel.
ATR at 0.46, or 1.8% of price, suggests volatility is moderate rather than explosive. That matters because a stock with moderate ATR and overbought oscillators can drift rather than snap — a key distinction for how traders read the next sessions. The volume backdrop is less convincing than the price action. Last volume was 26,372,000, below the 20-hour average of 38,883,075, or about 0.7x normal. Rising prices on lighter volume can still work, but they do not carry the same conviction as a breakout backed by heavier participation. The positive counterweight is that OBV is rising, which means cumulative trading flow has still been moving in the stock’s favor even if the latest session was not especially busy.
Key Levels & Scenarios
The immediate technical battleground is simple. $25.87 is both the latest price and the current resistance marker, so any follow-through needs to prove that the stock can move beyond this ceiling rather than just touch it. Above that, the next reference is the 3-month high at $26.02, and then the Bollinger upper band at $26.19. Those levels matter because they define where the chart can shift from “extended” to “breakout.”
On the downside, the first line of defense is $24.44, the middle Bollinger band and the 20-day average. If price slips back there, it would suggest the market is cooling off and reverting toward its short-term mean. Below that, $23.06 is the important support level from the 20-hour range and also a clear marker for whether the recent advance is still intact. A break below that would weaken the current uptrend structure and tell traders the latest push has lost traction.
Technical Verdict: HOLD (wait & see)
HOLD (wait & see)
- RSI at 71.8 and Stochastic at 94.4/96.0 show the stock is overbought, which raises the odds of a pause or pullback.
- MACD remains positive with the histogram above zero, so the uptrend is still supported.
- Price is pressing against resistance at $25.87 and near the $26.02 three-month high, while volume is only 0.7x normal, which weakens the case for immediate continuation.
- Verdict invalidated if price falls below $23.06, which would break the nearest support and damage the current trend structure.
- Ideal entry range: $24.44 to $25.87
- Exit target: $26.02 to $26.19
- Stop loss protection: below $23.06
In plain English: the chart still leans upward, but it looks tired enough that the next move matters more than the last one.
“The stock is strong, but it has reached the point where strength has to prove itself again.”