Tencent Stock Gains 1.23%, Testing Support Level In Focus
On Agustus 27, 2026: price 445.40 HKD, trend sideways, RSI 43.5, support 440.00, resistance 492.20. technical analysis of tencent stock.
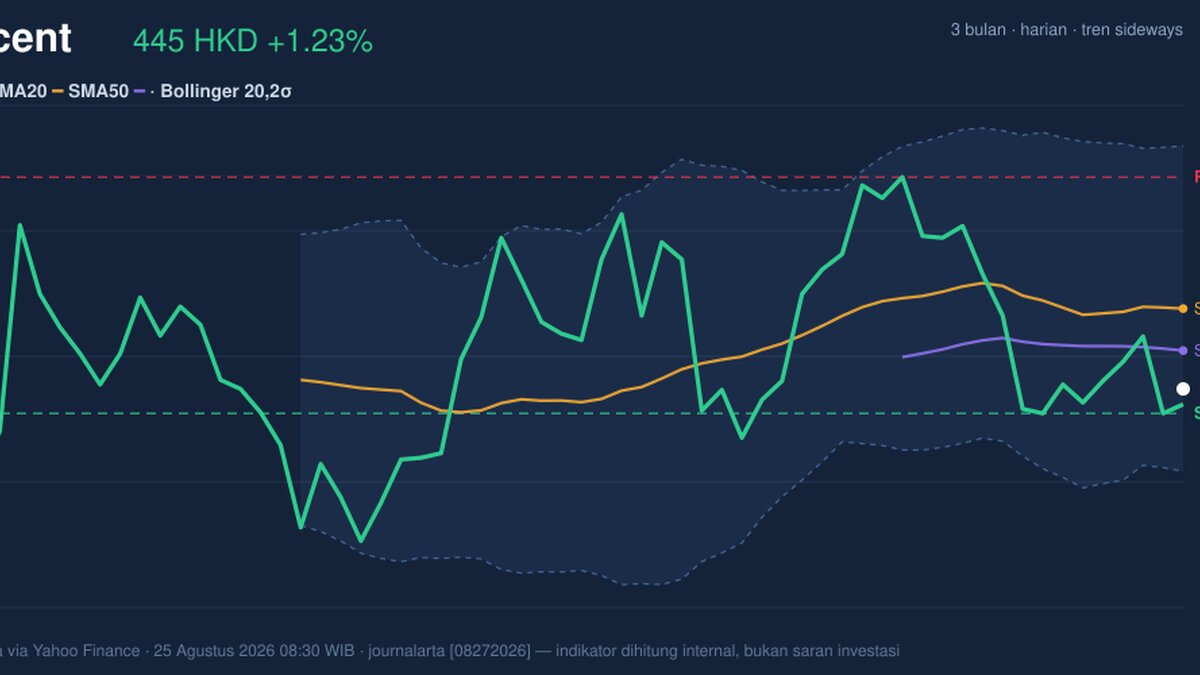
Tencent Holdings slipped to 445.40 HKD on HKEX in Hong Kong, recovering 1.23% on the day but still trading below its short- and medium-term trend lines, a setup that says the market is stabilising rather than convincingly reversing. The shares remain in a sideways phase, and the chart shows a stock that has bounced from the lower half of its range without yet reclaiming the levels that would signal stronger follow-through.
Trend & Price Action
As shown in the chart, Tencent is sitting below SMA20 at 463.14 and below SMA50 at 453.88, which matters because both moving averages act as reference points for trend participants. When price stays under those lines, rallies are often treated as tests of overhead supply rather than the start of a clean uptrend. The lack of a fresh MA-cross also tells the same story: there is no new moving-average signal to suggest that the recent drift has turned into a stronger directional move.
The broader structure is still range-bound. The stock is trading above the 3-month low of 411.00 but below the 3-month high of 497.80, and the current price sits near the lower third of that span. That positioning is important: it shows Tencent has not broken down, but it also has not reclaimed enough ground to leave the correction zone behind.
Short line, big signal: the market is still waiting for confirmation.
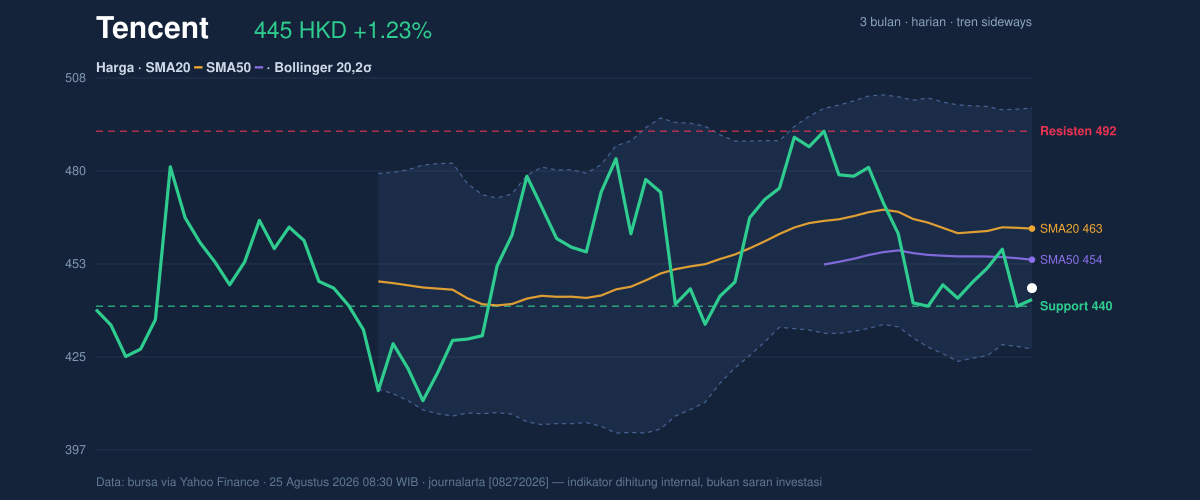
The nearby support at 440.00 is especially relevant because the last price is only slightly above it, meaning the recent bounce is fragile. On the upside, resistance at 492.20 remains a clear ceiling, and the chart suggests traders are likely to treat that area as the first real test of whether the rebound can broaden into something more durable.
Oscillators & Momentum
Momentum is mixed, and that mix is the clearest reason the stock has not yet earned a stronger technical label. The RSI at 43.5 is neutral, which means Tencent is neither stretched nor washed out on this measure. By itself, that would suggest balance. But the Stochastic %K at 10.9 and %D at 17.1 point to an oversold condition, implying the recent selling pressure may be getting tired in the short term. That can support a bounce, but oversold readings are not the same as a trend change; they often mark pauses inside weak charts as much as they mark bottoms.
The more cautionary signal comes from MACD at -4.291, with the signal line at -1.382 and the histogram at -2.909. In plain English, MACD is still negative and the gap versus the signal line says downside momentum remains in control. The histogram being below zero reinforces that the stock has not yet generated enough upward force to shift the near-term narrative.
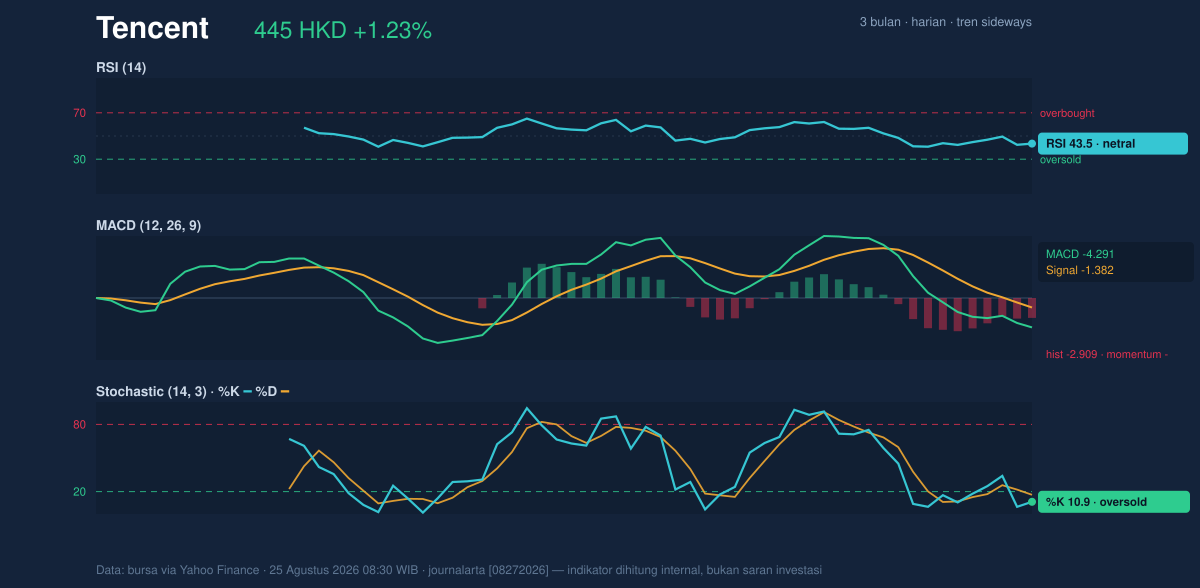
So the momentum picture is split: short-term oversold, but still trend-negative underneath.
Volatility & Volume
The Bollinger Bands help frame what kind of move may come next. Tencent is trading with %B at 25%, which places the price in the lower part of the band structure and closer to the lower band at 427.19 than to the upper band at 499.09. That positioning usually signals weakness or caution, but it also means the stock is not far from a zone where buyers have previously shown interest. The 15.5% band width is described as normal, so this is not a compression setup that often precedes an explosive breakout. Instead, it suggests a standard trading environment where direction still needs to be earned.
Volume does not yet confirm the rebound. The latest volume of 13,032,108 shares was only 0.5× the 20-day average of 26,653,521, which means the move happened on a quiet tape. That matters because price gains on light volume can fade if larger holders are not participating. The OBV is falling, and that is another warning that the recent lift has not been broadly supported by accumulation.
In other words, the bounce has not been powered by conviction.
Key Levels & Scenarios
The immediate map is straightforward. 440.00 is the first line to watch on the downside because it is both the latest support and very close to the current price. A clean hold there would keep the stock inside its recent trading band and leave room for a stabilisation attempt. If that level gives way, the next reference comes from the lower Bollinger band at 427.19, with the broader 3-month low at 411.00 still defining the lower boundary of the recent range.
On the upside, the first technical hurdle is the SMA50 at 453.88, followed by the SMA20 at 463.14. Those levels matter because reclaiming them would show that the stock is not just bouncing, but repairing. Above that, 492.20 stands as the near-term resistance that would need to be cleared before the market could even begin to challenge the 497.80 3-month high.
For now, Tencent is boxed in by a support shelf near 440.00 and overhead resistance near 492.20, with moving averages sitting above price and momentum still negative.
Technical Verdict: HOLD (wait & see)
HOLD (wait & see) fits the current setup because the stock is showing a short-term bounce, but not enough technical proof of a trend reversal.
- MACD remains negative, so downside momentum has not fully cleared.
- Price is below SMA20 and SMA50, which keeps the broader technical posture weak.
- Stochastic is oversold, but volume is only 0.5× average and OBV is falling, so the rebound lacks strong confirmation.
Verdict invalidated if price falls below 440.00, because that would expose the lower band at 427.19 and weaken the current support base.
- Ideal Entry Range: 440.00 to 453.88
- Exit Target: 463.14 to 492.20
- Stop Loss Protection: below 427.19, with 411.00 as the broader risk marker
For non-traders: Tencent is trying to steady itself, but the chart still needs stronger proof before the rebound can be trusted.
“Until the stock can reclaim its moving averages, this is a market that is still asking for evidence.”
Summary Data Tencent
| Last price | 445.40 HKD |
| Change 1 day / 5 days / 1 month | 1.23% / 0.68% / -0.40% |
| Trend / MA-cross | sideways / none |
| SMA20 / SMA50 | 463.14 / 453.88 |
| RSI (14) / Stochastic %K | 43.5 / 10.9 |
| Bollinger %B / ATR | 25% / 11.86 |
| Support / Resistance 20 days | 440.00 / 492.20 |
| Data as of | 25 Agustus 2026 08:30 WIB |
Track Tencent share price daily: live levels, support/resistance and our full Tencent analysis history.



