UOB Stock Gains 0.54%, Momentum Weakens In Focus
On Agustus 27, 2026: price 40.95 SGD, trend sideways, RSI 43.2, support 40.22, resistance 43.89. technical analysis of uob stock. UOB Stock Gains — full…
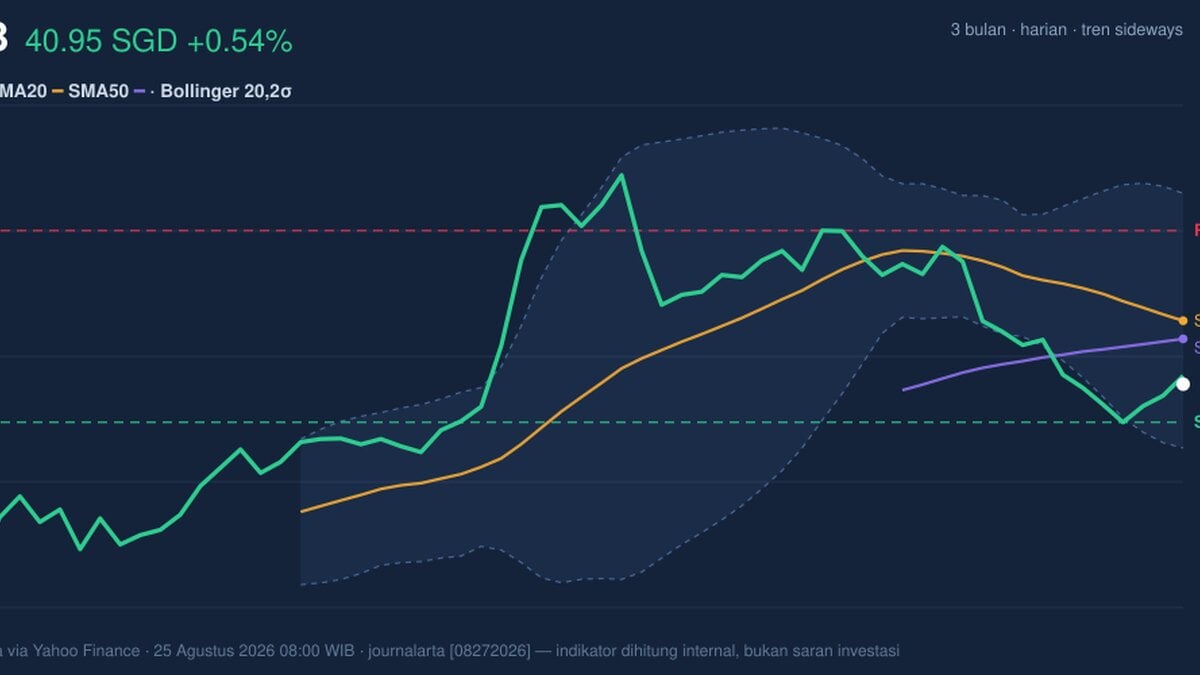
United Overseas Bank’s shares on the Singapore Exchange were trading at SGD 40.95 on 25 August 2026, up 0.54% from the previous close of 40.73, but the move sits inside a broader patch of weakness rather than a clean recovery. The stock is still below its SMA20 at 42.17 and below its SMA50 at 41.82, which tells the market that recent prices have not yet reclaimed the short- to medium-term trend. As shown in the chart, UOB is sitting closer to the lower half of its recent band than the upper half, and that positioning matters because it suggests buyers are defending the name, but not yet with enough conviction to reverse the drift.
Trend & Price Action
The chart shows a stock that is moving sideways, but with a slight downward bias in the near term. The SMA20 slope of -1.45% over 5 days signals that the short-term average is still leaning lower, which usually means rallies are being sold into rather than extended into a new up leg. There is no fresh MA-cross, so there is no technical evidence yet of a momentum shift from weak to strong. That absence is important: when a stock trades below both moving averages without a new crossover, it often means the market is waiting for a catalyst rather than pricing one in.
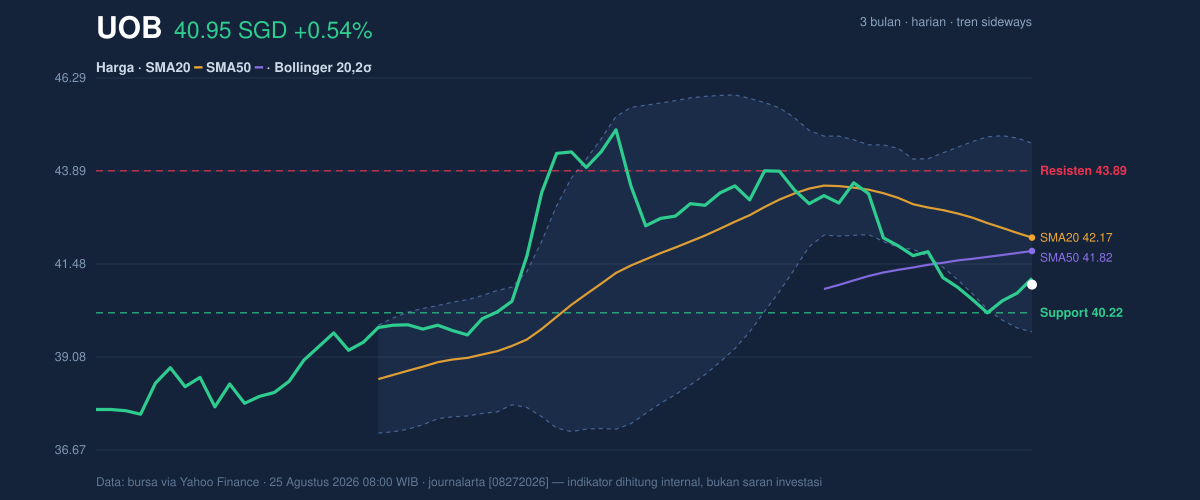
UOB’s current price is also near the lower part of its 3-month range, with the stock between the 3-month low of 37.52 and the 3-month high of 45.15. That placement suggests the recent bounce has not yet repaired the damage done by the -5.86% decline over the past month. In plain terms, the share price is not in freefall, but it is still trading with caution baked in.
Oscillators & Momentum
Momentum indicators are not flashing panic, but they are not confirming a sustained rebound either. The RSI at 43.2 sits in neutral territory, which means the stock is neither oversold enough to signal exhaustion on the downside nor strong enough to imply broad buying pressure. The Stochastic %K at 33.8 and %D at 25.5 also remain neutral, but they are closer to the lower end of the scale, hinting that short-term momentum is still subdued rather than enthusiastic.
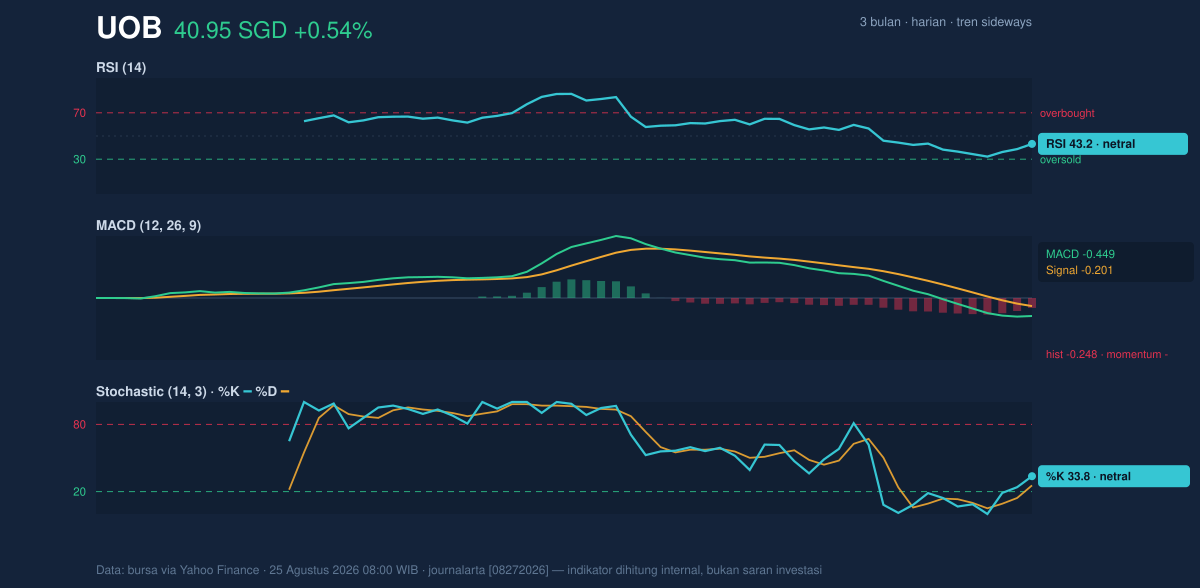
The more telling signal comes from MACD. With MACD at -0.449, below the signal line at -0.201, and a histogram of -0.248, the setup points to negative momentum that has not yet fully turned. For readers less familiar with the term, MACD compares faster and slower price trends; when it stays below the signal line, it usually means the recent trend is still weaker than the longer one. That does not guarantee further losses, but it does mean any recovery attempt is still fighting the tape.
Volatility & Volume
Volatility is present, but not extreme. The ATR(14) of 0.68, equal to 1.7% of price, indicates moderate daily movement, which is enough to matter for near-term traders without suggesting disorder. The Bollinger Bands reinforce that picture: price is sitting above the lower band at 39.73, below the middle band at 42.17, and well under the upper band at 44.60. With %B at 25% and a normal band width of 11.6%, the stock is not in a squeeze that would usually precede a sharp breakout. Instead, the band position says UOB is trading in the lower quarter of its recent volatility envelope, which keeps the bias cautious unless price can push back through the middle band.
Volume also leans against a forceful rebound. The last session’s volume of 2,631,900 was only 0.7x the 20-day average of 3,761,852, and OBV is falling. That combination matters because a price rise on lighter turnover often lacks commitment, while declining OBV suggests the cumulative flow of volume has not yet turned supportive. In other words, the latest uptick looks more like a tentative bid than a broad-based accumulation phase.
Key Levels & Scenarios
The nearest technical floor is support at 40.22, while the first meaningful ceiling is resistance at 43.89. UOB is currently trading in the lower 20% of that range, which keeps the near-term setup defensive. If the share price can reclaim the 42.17 Bollinger middle band and hold above it, the market would be signaling that the recent pullback is losing force. If it fails to hold 40.22, the chart would invite a retest toward the lower band at 39.73, and that would deepen the sense that sellers still control the tape.
The key signal to watch is whether price can move back above both moving averages and do so with stronger volume. Without that, the current bounce remains technically fragile, because the stock is still below the levels that would normally confirm a trend repair. The latest session’s modest gain is useful, but it is not yet enough to override the broader pattern of lower momentum and weak participation.
Technical Verdict: HOLD (wait & see)
HOLD (wait & see)
- MACD remains negative, with the line below the signal line and a negative histogram, so downside momentum has not fully cleared.
- Price is below SMA20 at 42.17 and SMA50 at 41.82, which keeps the short-term trend structure weak despite the day’s gain.
- Volume is only 0.7x the 20-day average and OBV is falling, so the rebound lacks confirmation from participation.
- Verdict invalidated if price falls below 40.22, because that would break the nearest support and expose the lower Bollinger area at 39.73.
- Ideal Entry Range: 40.22 to 41.82
- Exit Target: 42.17 to 43.89
- Stop Loss protection: below 40.22
In plain English, UOB is not showing enough technical strength to say the recent bounce has turned into a real trend change.
Summary Data UOB
| Last price | 40.95 SGD |
| Change 1 day / 5 days / 1 month | 0.54% / 0.17% / -5.86% |
| Trend / MA-cross | sideways / none |
| SMA20 / SMA50 | 42.17 / 41.82 |
| RSI (14) / Stochastic %K | 43.2 / 33.8 |
| Bollinger %B / ATR | 25% / 0.68 |
| Support / Resistance 20 days | 40.22 / 43.89 |
| Data as of | 25 Agustus 2026 08:00 WIB |
Track UOB share price daily: live levels, support/resistance and our full UOB analysis history.



