AstraZeneca Stock Technicals Today: Drops 1.15%, Momentum Gains
On September 7, 2026: price 12,006.00 GBp, trend sideways, RSI 46.0, support 11,460.00, resistance 12,476.00. technical analysis of astrazeneca stock.
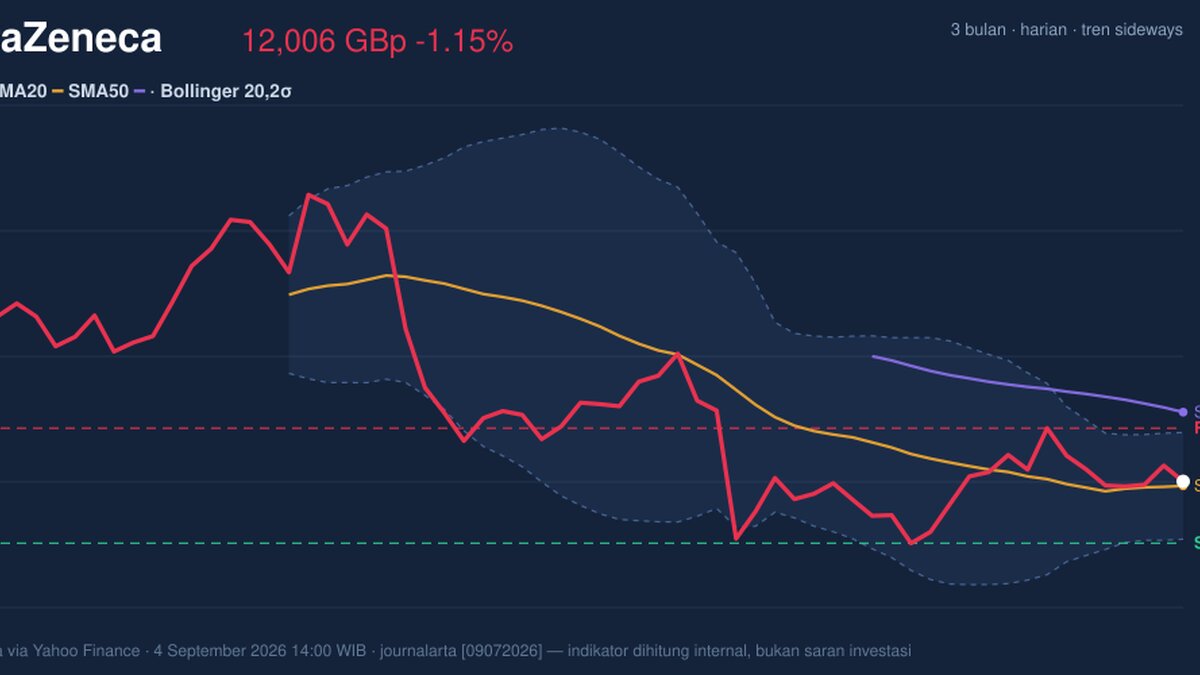
AstraZeneca’s London shares were 12,006.00 GBp at 14:00 WIB on 4 September 2026, down 1.15% on the day, leaving the stock slightly above its short-term average but still below the longer trend line, as shown in the chart. That positioning matters more than the day’s red number on its own: it suggests the market is not in a clear selloff, but neither is it showing the kind of broad, committed buying that would mark a decisive trend change.
Trend & Price Action
The share price is sitting above the SMA20 at 11,966.90 and below the SMA50 at 12,618.56, with the trend described as sideways and the SMA20 slope only 0.13% over 5 days. That combination usually signals a market in balance, where short-term buyers are defending dips but have not yet forced the stock back into a stronger intermediate uptrend. There is no fresh MA cross, so the chart is missing the clean momentum signal that often accompanies a sustained break higher or lower.
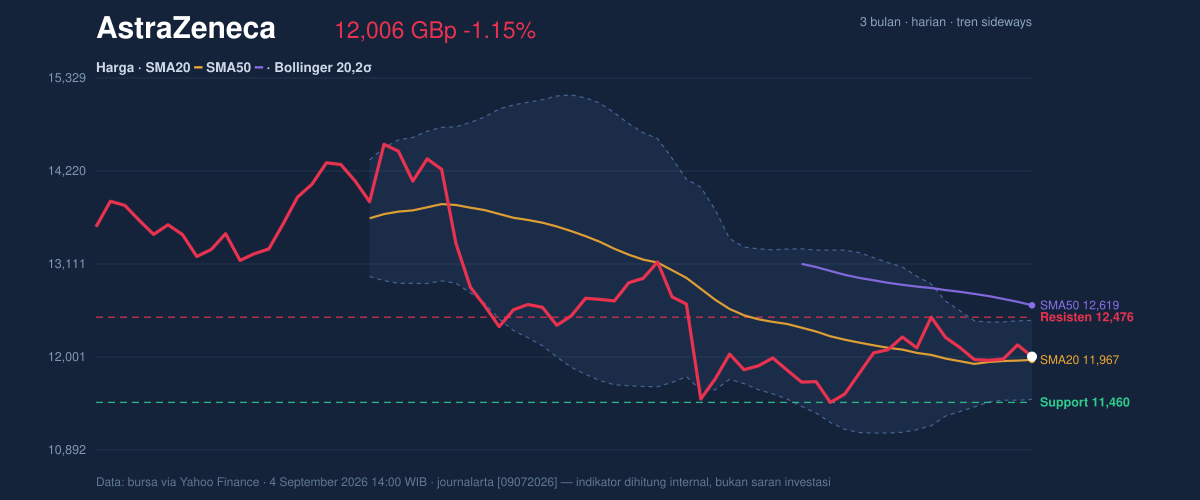
The price is also trading near the middle of its recent band, at 54% of the 20-hour range, with support at 11,460.00 and resistance at 12,476.00. In plain terms, that means the stock is not pressed against a floor or ceiling; it is hovering in the middle, where direction is often decided by the next burst of volume rather than by the current drift. The broader 3-month range, from 9,892.00 to 15,126.00, shows that the current level is neither distressed nor stretched, which fits the sideways reading.
Oscillators & Momentum
The momentum picture is more constructive than the flat trend might first suggest. RSI at 46.0 is neutral, which tells readers the stock is not overbought and not oversold. That is important because neutral RSI often leaves room for either direction; it does not itself force a reversal, but it also does not warn that the move has become overheated.
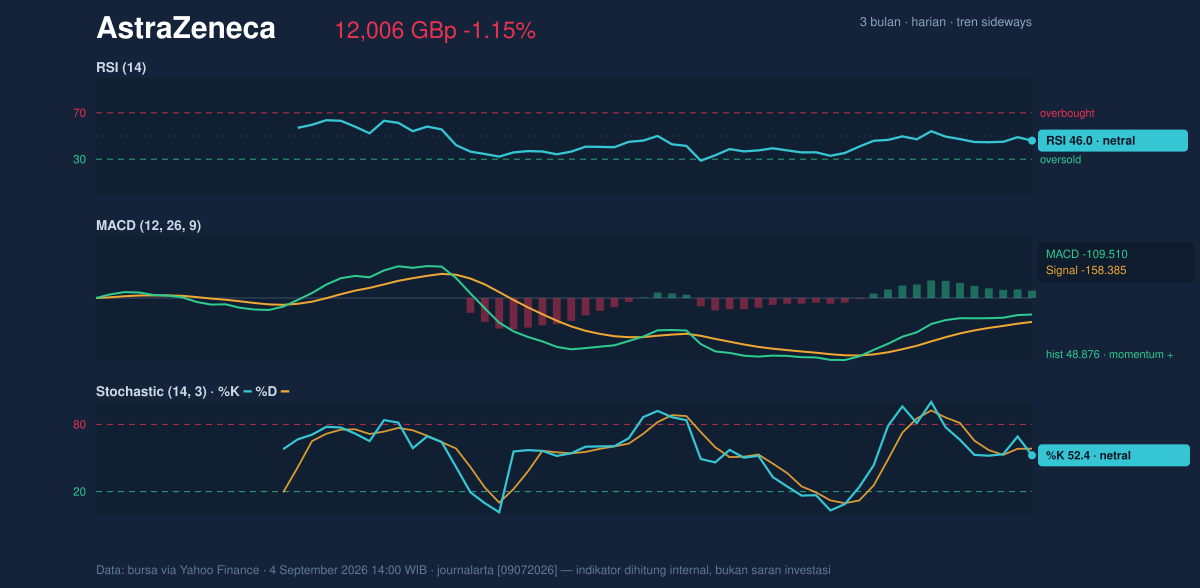
The Stochastic reading of 52.4 / 58.3 is also neutral, reinforcing the idea that the shares are not yet in an extreme zone. The more notable signal is the MACD at -109.510, which remains below zero, while the signal line is -158.385 and the histogram is 48.876. That matters because a negative MACD still says the medium-term trend has not fully recovered, but the positive histogram shows the gap is narrowing. In other words, downside momentum is fading even though the stock has not crossed into a confirmed bullish phase.
Volatility & Volume
The volatility setup looks poised rather than calm. The Bollinger bands are narrowing, with a width of 7.9% and %B at 54%. A squeeze like this often means the market is storing energy rather than expressing it; prices can spend time compressing before a sharper move emerges. Because the price is near the middle of the band, the chart is not screaming extension in either direction, but it is hinting that the next significant move could be larger than the recent day-to-day drift.
The ATR(14) at 295.00, or 2.5% of price, points to moderate volatility. That is enough for a meaningful swing, but not enough to imply disorder. Volume, however, is softer than ideal for a breakout story. The latest turnover of 2,248,699 compares with a 20-day average of 3,373,064, or just 0.7x normal, while OBV is falling. OBV, or on-balance volume, tracks whether trading flow is supporting price; a decline there suggests that recent moves have not been backed by strong accumulation. That weak participation keeps the rally case from looking fully confirmed.
Key Levels & Scenarios
The immediate technical map is clear. 12,476.00 is the first resistance that matters, because it sits just above the current trading zone and near the upper edge of the recent range. A push through that level would show the stock is no longer stuck in the middle of the band and could begin testing the SMA50 at 12,618.56. On the downside, 11,460.00 is the key support to watch. A break below that would not only damage the short-term structure, it would also put the price under the Bollinger midline and suggest the recent stabilization has failed.
The chart setup is therefore best read as a compression phase with mixed confirmation: price is holding above the short average, momentum is improving at the margin, but volume is not yet validating a stronger advance. That is why the stock looks more like a waiting pattern than a clean trend.
Technical Verdict: HOLD (wait & see)
HOLD (wait & see)
- RSI 46.0 and Stochastic 52.4 / 58.3 are neutral, so momentum is neither stretched nor decisive.
- MACD histogram 48.876 is positive, but the MACD line remains below zero, showing improvement without full confirmation.
- Bollinger bands are squeezing at 7.9%, while volume is only 0.7x normal and OBV is down, so the move lacks participation.
- Invalidation condition: this verdict is invalidated if price falls below 11,460.00.
- Ideal entry range: 11,966.90 to 12,476.00
- Exit target: 12,618.56
- Stop loss protection: 11,460.00
For non-traders, this means the shares are not showing a strong enough signal yet to call the next move with confidence. The latest price was 12,006.00 GBp.
Summary Data AstraZeneca
| Last price | 12,006.00 GBp |
| Change 1 day / 5 days / 1 month | -1.15% / -0.89% / 1.32% |
| Trend / MA-cross | sideways / none |
| SMA20 / SMA50 | 11,966.90 / 12,618.56 |
| RSI (14) / Stochastic %K | 46.0 / 52.4 |
| Bollinger %B / ATR | 54% / 295.00 |
| Support / Resistance 20 days | 11,460.00 / 12,476.00 |
| Data as of | 4 September 2026 14:00 WIB |
Track AstraZeneca share price daily: live levels, support/resistance and our full AstraZeneca analysis history.