BP Stock Drops 0.00%, Momentum Gains In Focus
On September 7, 2026: price 539.70 GBp, trend sideways, RSI 54.7, support 514.50, resistance 552.20. technical analysis of bp stock. BP Stock Drops — full…
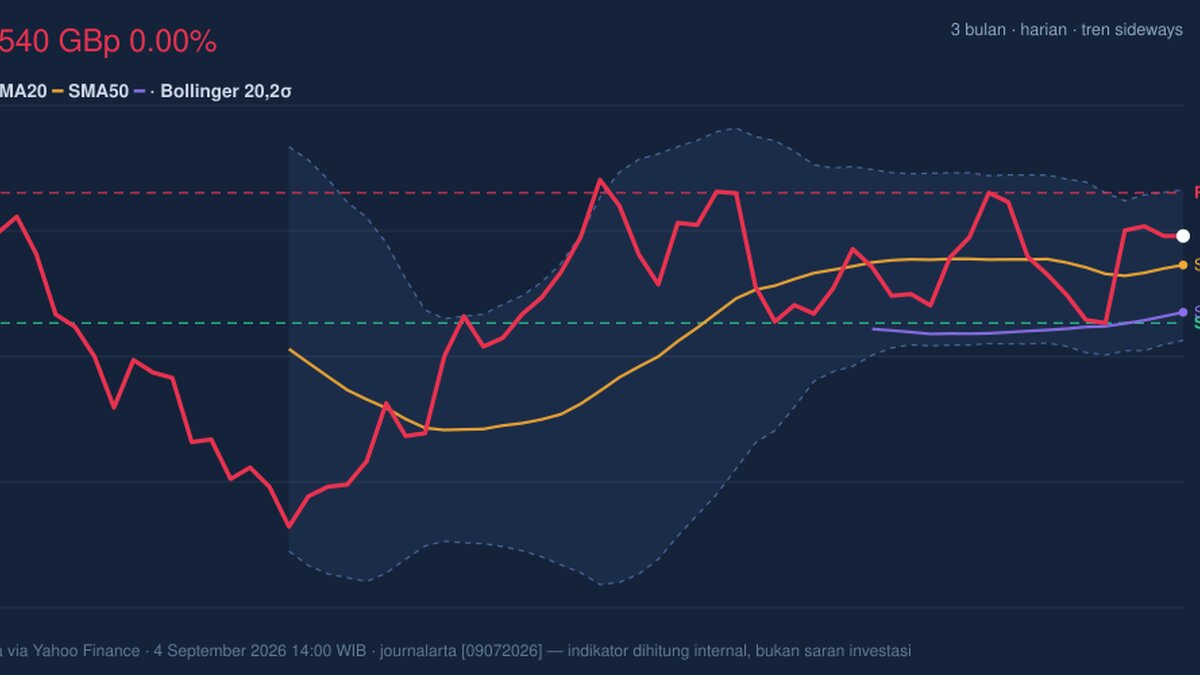
BP plc is holding a constructive but not decisive technical posture on the London market, with the shares sitting above short- and medium-term trend markers while momentum remains positive but not strong enough to call it a breakout.
At 539.70 GBp, BP ended unchanged on the day, but the broader tape has been firmer: the stock is up 4.71% over five days and 3.85% over one month, according to data from Yahoo Finance via the London Stock Exchange. That matters because it suggests the recent move is not random noise; it is a recovery that has been building inside a still-rangebound structure. The shares are trading above both the SMA20 at 531.30 and the SMA50 at 517.65, which tells investors the price is above the average levels watched by short- and medium-term traders. Yet the trend is still described as sideways, and the SMA20 slope of 0.13% over five days signals only a mild upward drift rather than a decisive trend acceleration.
Trend & Price Action
The key message from the chart is balance, not escape. The stock is positioned in the upper part of its recent range, at 67% of the 20-hour range, with 20-hour support at 514.50 and 20-hour resistance at 552.20. That placement suggests buyers have been willing to defend dips, but the market has not yet forced a clean move through resistance. The broader three-month range reinforces that view: the shares are still below the 3-month high of 562.90 and well above the 3-month low of 450.60.
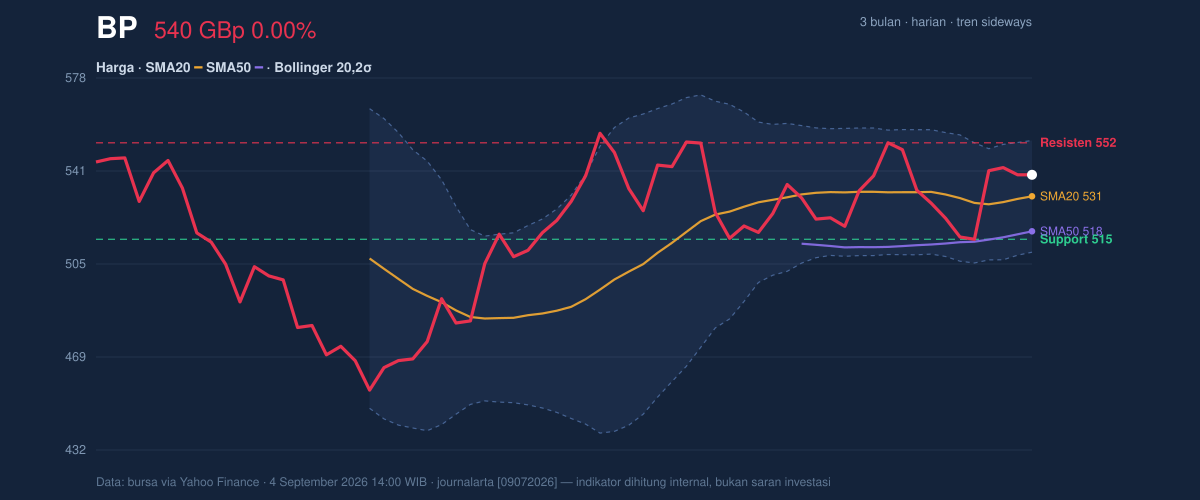
The Bollinger Bands help explain why the price has not yet produced a sharper directional move. The bands are relatively contained, with a normal 8.2% width, which usually means volatility is present but not stretched. The price sits at %B 69%, so BP is trading in the upper portion of the band, closer to the top than the middle. In plain language, that is constructive, but it is not the same as an overextended move. The price has room to test the upper band at 553.10, but it has not yet shown the kind of expansion that typically accompanies a strong trend break.
The absence of a fresh moving-average crossover also matters. There is no new MA-cross, so the chart does not yet have the extra confirmation that often comes when a shorter average decisively overtakes a longer one. In practical terms, the shares are improving, but the structure still looks like a range with a positive bias rather than a full trend reversal.
Oscillators & Momentum
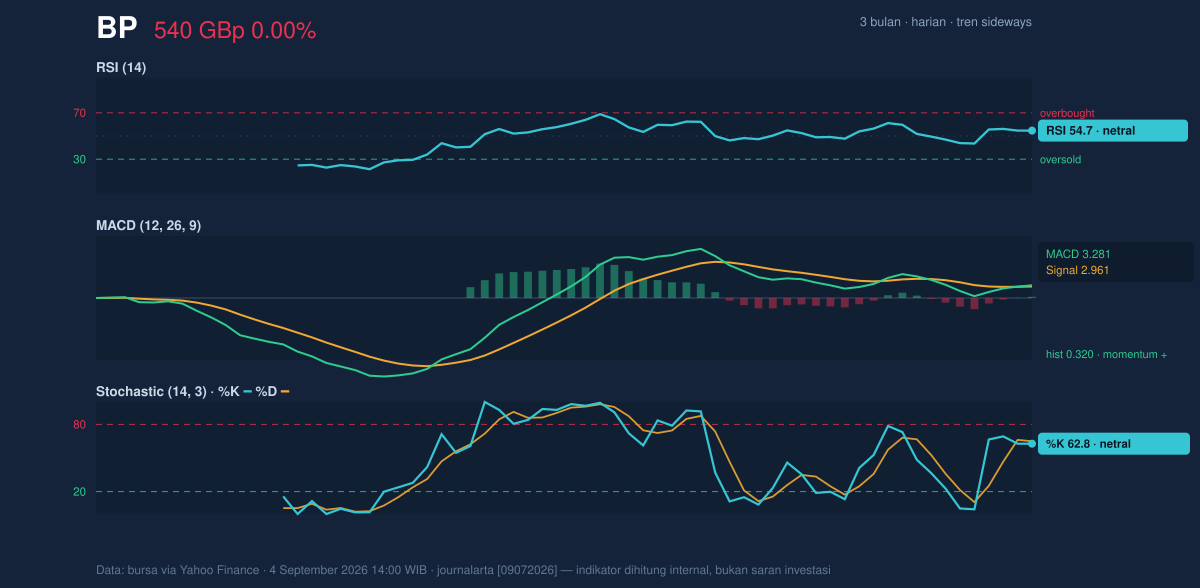
Momentum indicators are supportive, but they are not shouting. The RSI at 54.7 sits in neutral territory, which means the stock is neither overbought nor oversold. That is often a healthy sign after a modest rise: the move has not yet become crowded. The Stochastic %K at 62.8 and %D at 65.0 are also neutral, with no sharp momentum divergence visible. This tells readers that the latest advance has not yet run into obvious exhaustion.
The more encouraging signal comes from MACD. The MACD at 3.281 is above the signal line at 2.961, and the histogram at 0.320 is positive. That combination typically means upward momentum is still in place, even if it is not accelerating aggressively. Put simply: the stock is moving with a positive bias, but the oscillators do not yet confirm a strong breakout regime. That is consistent with the sideways trend and the modest slope in the moving average.
Volatility & Volume
Volatility is moderate rather than explosive. The ATR(14) at 14.16, equal to 2.6% of price, suggests a normal day-to-day swing profile for a large-cap energy name rather than a highly compressed or highly erratic setup. Combined with the Bollinger width, this points to a market that can move, but not one that is currently under stress.
Volume, however, adds a note of caution. The latest turnover was 43,920,382, below the 20-hour average of 50,598,274, or about 0.9× normal. That means the recent price resilience has not been backed by stronger-than-usual participation. The OBV is falling, which is an important nuance: on-balance volume tracks whether volume is flowing into rising prices or out of them. A declining OBV while price holds up can imply that the advance is not yet fully supported by accumulation. In other words, the chart is constructive, but participation is not fully confirming it.
Key Levels & Scenarios
The immediate technical map is clear. 552.20 is the first resistance to watch, with the Bollinger upper band at 553.10 sitting just above it. A move through that area would suggest BP is trying to leave the range behind and challenge the 3-month high of 562.90. On the downside, 531.30 is the first important pivot because it is both the SMA20 and the Bollinger midline, while 514.50 is the more important support that has to hold to preserve the current constructive setup. Below that, the chart would begin to lean more defensive, especially given the falling OBV.
If BP clears 552.20 and holds above the upper band, the chart would signal stronger upside intent. If it slips back below 531.30, the recent bounce would look less convincing. If 514.50 fails, the current bullish bias would be materially weakened.
Technical Verdict: HOLD (wait & see)
HOLD (wait & see)
- MACD is positive, so momentum is still pointing upward.
- Price is above SMA20 and SMA50, which supports the current recovery.
- RSI and Stochastic are neutral, while OBV is falling, so confirmation is incomplete.
Verdict invalidated if price falls below 514.50.
- Ideal Entry Range: 531.30 to 514.50
- Exit Target (Target Price): 552.20 to 553.10
- Stop Loss protection: below 514.50
For non-traders, this means BP’s chart is improving, but the move still needs stronger confirmation before it looks like a clean new trend.
Summary Data BP
| Last price | 539.70 GBp |
| Change 1 day / 5 days / 1 month | 0.00% / 4.71% / 3.85% |
| Trend / MA-cross | sideways / none |
| SMA20 / SMA50 | 531.30 / 517.65 |
| RSI (14) / Stochastic %K | 54.7 / 62.8 |
| Bollinger %B / ATR | 69% / 14.16 |
| Support / Resistance 20 days | 514.50 / 552.20 |
| Data as of | 4 September 2026 14:00 WIB |
Track BP share price daily: live levels, support/resistance and our full BP analysis history.