Shell Stock Gains 0.16% Today, Testing Key Resistance
On September 7, 2026: price 3,437.00 GBp, trend uptrend, RSI 60.2, support 3,277.50, resistance 3,443.00. technical analysis of shell stock.
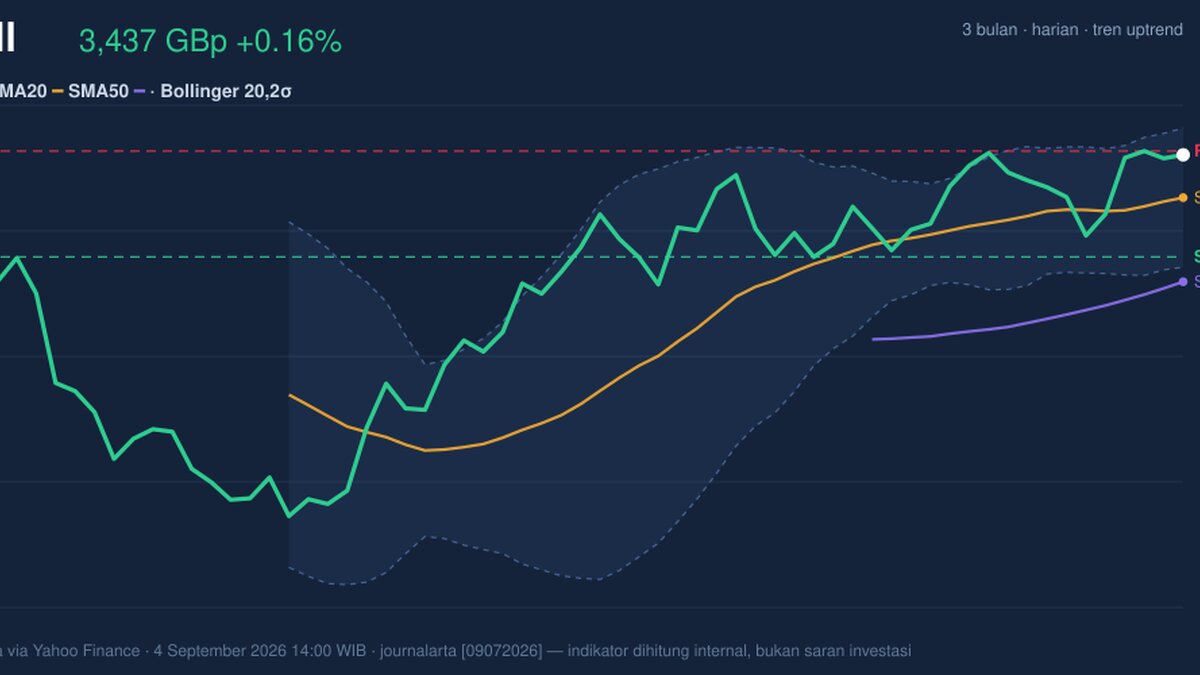
Shell plc edged higher on the London Stock Exchange on 4 September 2026, with the shares last changing hands at 3,437.00 GBp, just above the previous close of 3,431.50. The move is small in daily terms, but the structure behind it matters more than the headline change: Shell is trading above its SMA20 at 3,370.18 and well above SMA50 at 3,238.75, which keeps the medium-term trend pointed upward even as some short-term momentum indicators cool.
Trend & Price Action
The first message from the chart is that Shell remains in an uptrend, and not a fragile one. The 20-day moving average is still rising, with a slope of 0.57% over 5 days, which tells readers that the recent advance is not just a one-day spike but part of a broader climb. Price sitting above both the 20-day and 50-day averages usually signals that buyers have been willing to pay up through recent trading sessions, and that the market has not yet shifted into a defensive posture.
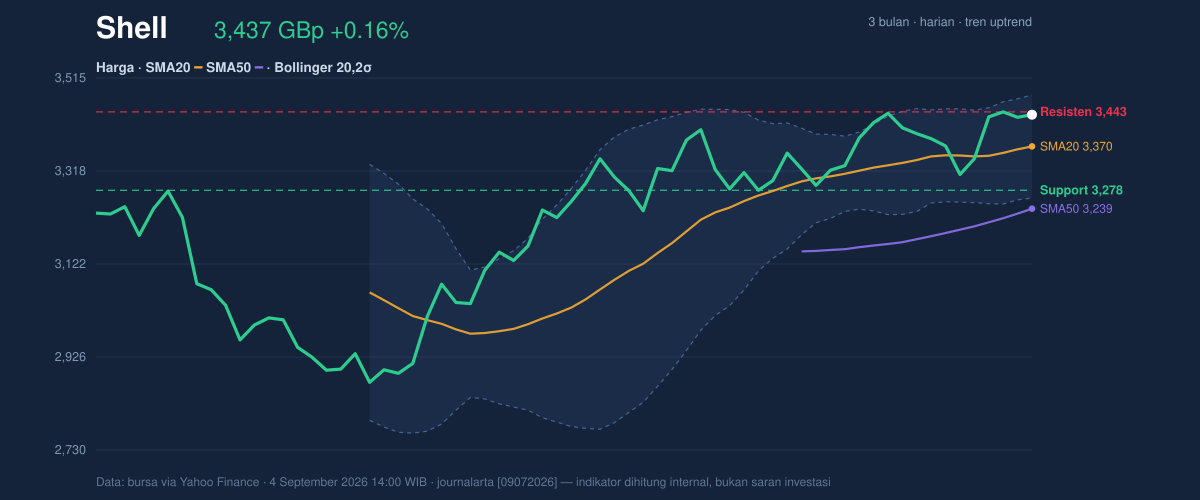
That said, the stock is now pressing into a more crowded part of the range. The 20-hour support sits at 3,277.50 while 20-hour resistance is 3,443.00, and the current price is already at 96% of that range. In plain English, Shell is trading close to the upper end of its recent lane, so the market is asking whether it can keep extending higher or whether it pauses to digest gains. The broader three-month band shows there is still room before the prior peak at 3,758.50, but the immediate test is whether the shares can clear the nearby ceiling without losing momentum.
Oscillators & Momentum
The oscillators are less enthusiastic than the price trend, which is often where the useful signal lies. RSI at 60.2 is still neutral rather than stretched, meaning Shell is not yet in the classic overbought zone that often precedes a sharp pullback. Stochastic %K at 78.6 and %D at 81.0 are sitting near the upper end of the scale, which suggests the shares are close to a short-term turning point even if they are not screaming reversal.
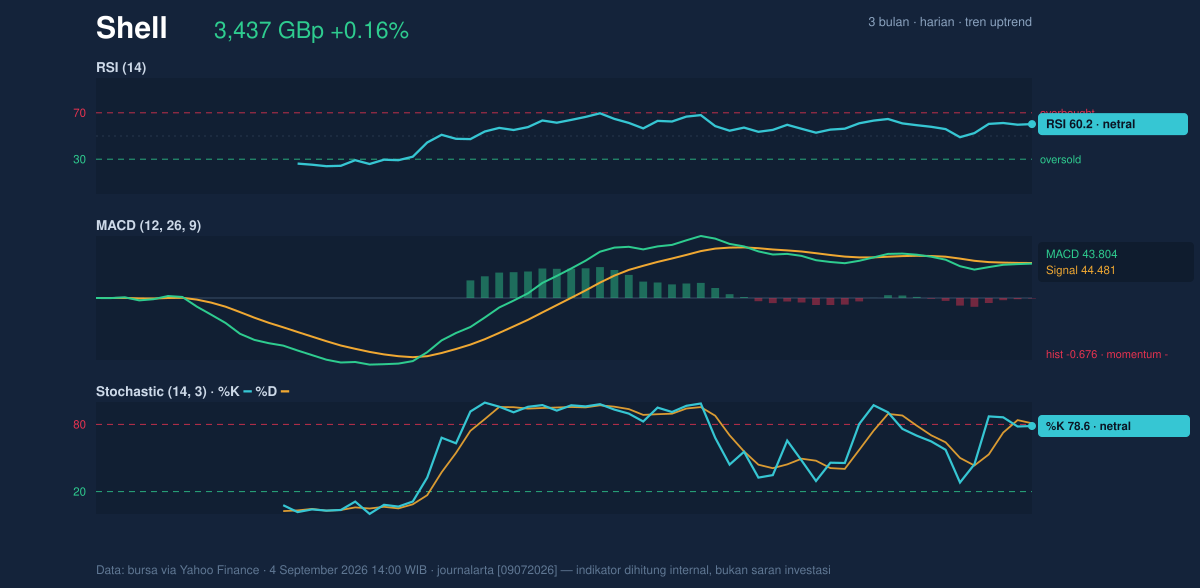
The bigger warning comes from MACD. MACD at 43.804 remains below its signal line at 44.481, with a -0.676 histogram. That combination matters because it says the trend is still positive on price structure, but the pace of upside momentum has slipped below its recent average. In practical terms, the chart is not bearish, but it is less forceful than the price action alone would suggest. When MACD lags while price sits near resistance, traders often watch for either a fresh breakout backed by volume or a brief consolidation that resets momentum.
Volatility & Volume
Volatility is contained, not absent. Shell’s ATR(14) of 53.25 equals about 1.5% of price, which points to moderate daily movement rather than a volatile swing regime. That matters because the Bollinger Bands are also tightening: the band width is only 6.4%, and the setup is described as a squeeze, which often precedes a larger directional move. Squeezes do not predict direction by themselves, but they do warn that the current calm may not last.
The price is also trading with some conviction. Volume of 12,314,657 is about 1.2× normal versus the 20-day average of 10,578,911, and OBV is rising. That combination is constructive because it shows participation is still broad enough to support the move. Rising OBV means volume has been accumulating on net with price, which usually strengthens the case that the trend is being backed by real demand rather than a thin, low-liquidity drift. The catch is that volume support has not yet translated into a clean breakout above resistance, so the market is still waiting for confirmation.
The Bollinger position also deserves attention. With %B at 81%, Shell is trading in the upper part of its band, close to the 3,478.83 upper boundary. That tells readers the stock is leaning toward the top of its recent volatility envelope, which often makes 3,443.00 resistance the key near-term battleground. If price can close above that area with volume, the squeeze could resolve upward; if not, the stock may drift back toward the 3,370.18 mid-band and 20-day average.
Technical Verdict: HOLD (wait & see)
HOLD (wait & see)
- Price is above SMA20 and SMA50, which keeps the trend constructive.
- MACD is negative versus its signal line, showing momentum has softened even as price remains elevated.
- Bollinger Bands are in a squeeze, so the next move could be meaningful, but direction is not yet confirmed.
Verdict invalidated if price falls below 3,277.50, the 20-hour support that currently anchors the short-term range.
- Ideal Entry Range: 3,277.50 to 3,370.18, where support and the 20-day average overlap.
- Exit Target: 3,443.00 initially, then 3,478.83 if resistance gives way and the upper Bollinger band comes into play.
- Stop Loss protection: below 3,261.52, the lower Bollinger band, or beneath 3,277.50 if the short-term support fails first.
For non-traders, this means Shell’s chart is still healthy, but it is close enough to resistance that the market is waiting for proof before it commits to the next leg.
Summary Data Shell
| Last price | 3,437.00 GBp |
| Change 1 day / 5 days / 1 month | 0.16% / 3.81% / 3.68% |
| Trend / MA-cross | uptrend / none |
| SMA20 / SMA50 | 3,370.18 / 3,238.75 |
| RSI (14) / Stochastic %K | 60.2 / 78.6 |
| Bollinger %B / ATR | 81% / 53.25 |
| Support / Resistance 20 days | 3,277.50 / 3,443.00 |
| Data as of | 4 September 2026 14:00 WIB |
Track Shell share price daily: live levels, support/resistance and our full Shell analysis history.