Testing Key Resistance, OCBC Stock Gains 1.10% Today
On September 7, 2026: price 32.27 SGD, trend uptrend, RSI 69.8, support 30.30, resistance 32.27. technical analysis of ocbc stock. Testing Key Resistance —…
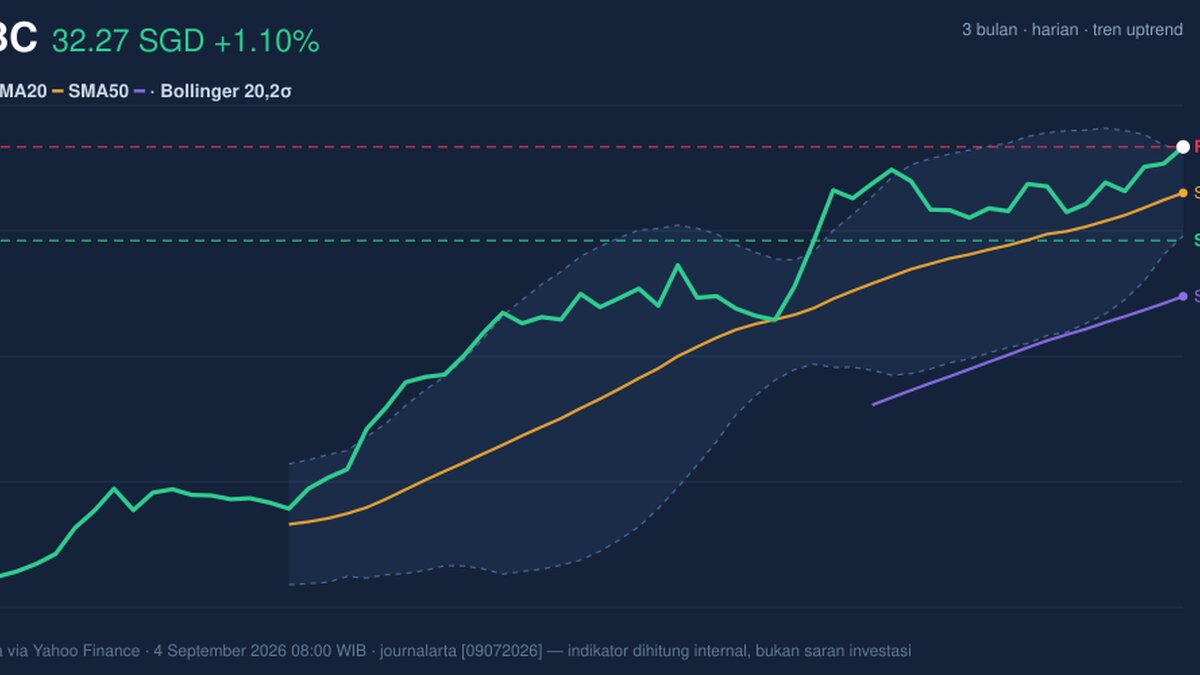
OCBC Bank’s shares on SGX rose to SGD 32.27, up from SGD 31.92 the previous close, extending a run that has lifted the stock 3.86% over five days and 10.02% over one month. The move matters because it has pushed the price to the very top of its recent trading range, while the chart now shows a tension between a still-friendly trend and momentum signals that are starting to look stretched.
Trend & Price Action
The broader structure remains constructive. OCBC is trading above its SMA20 at SGD 31.30 and well above its SMA50 at SGD 29.13, which means the short-term trend is still aligned with the medium-term trend. The uptrend is also supported by the SMA20 slope of 2.32% over five days, a sign that the average itself is rising rather than flattening out. As shown in the chart, that combination usually tells traders the market is still willing to pay higher prices, even if the pace of gains is becoming less orderly.
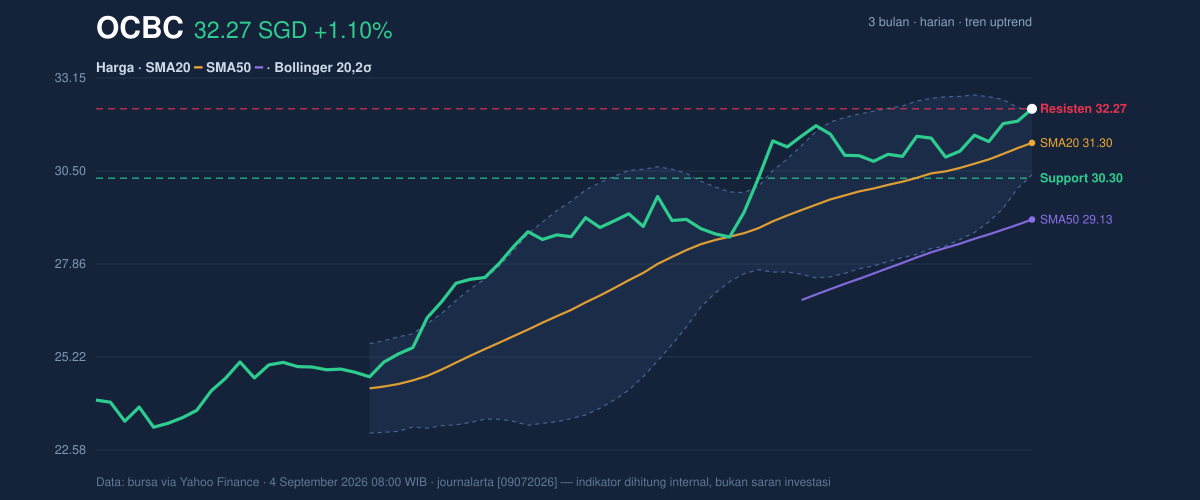
What makes the latest session more interesting is where the price sits inside the range. The stock is at 100% of its 20-hour range, with support at SGD 30.30 and resistance at SGD 32.27. In plain terms, the share price has reached the ceiling of the near-term band rather than breaking cleanly into a new one. That is often where traders start asking whether buyers still have enough force left to push through, or whether the market needs to pause and rebuild.
The 3-month high of SGD 32.57 is now close enough to matter. It acts less like a distant reference point and more like the next test of conviction, especially after a month-long climb of more than 10%. If OCBC can hold above the upper end of the recent range, the chart would be signaling continuation; if it cannot, the recent advance may simply be digesting gains.
Oscillators & Momentum
The momentum picture is mixed rather than cleanly bullish. The RSI at 69.8 is still described as neutral in the data, but it is hovering just below the classic overbought line, which means the stock is close to a zone where rallies can become harder to extend without a pause. The Stochastic oscillator at 87.3 / 87.9 is more explicit: it is overbought, and as shown in the chart, that usually means the recent price rise has been fast enough that short-term enthusiasm may be running ahead of fresh confirmation.
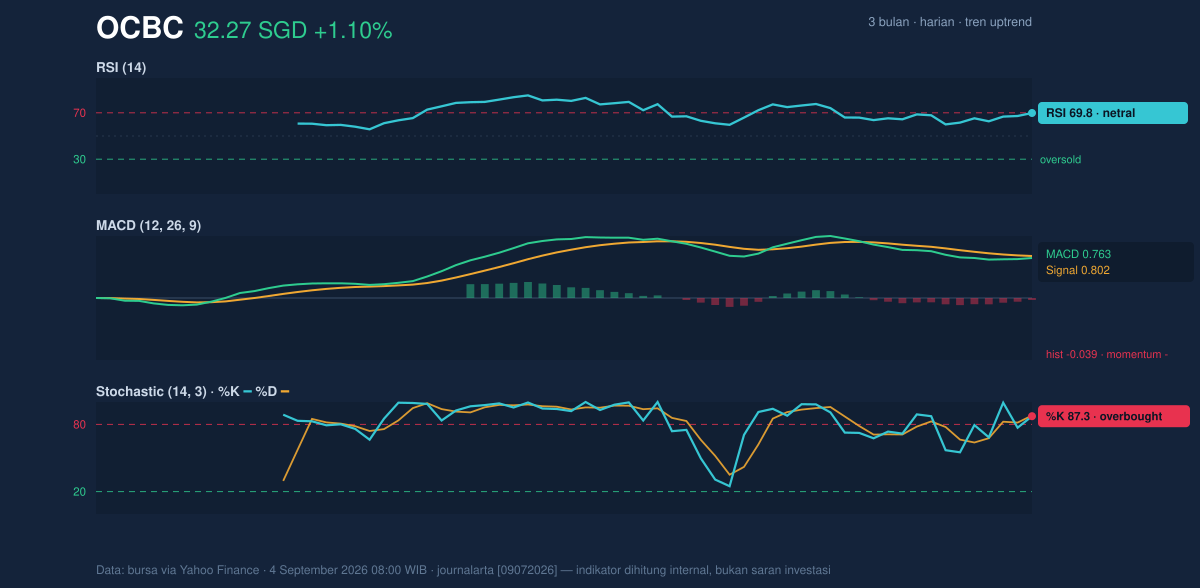
MACD is the more cautionary signal here. The MACD at 0.763 is still positive, but it sits below the signal line at 0.802, with a histogram of -0.039. That negative histogram tells readers the trend is not losing its uptrend status, but the pace of upside momentum has weakened. In technical terms, the market is still elevated, but the push is less forceful than before. When MACD turns softer while stochastic remains overbought, the usual message is not immediate reversal; it is that the stock may need consolidation to reset momentum.
Volatility & Volume
Volatility is present, but not extreme. The ATR(14) of 0.55 equals about 1.7% of price, which suggests movement is active enough to matter but not chaotic. More notable is the Bollinger setup. The bands are tightly packed, with the upper band at SGD 32.21, the middle band at SGD 31.30, and the lower band at SGD 30.40. The 5.8% band width is described as a squeeze, which often precedes a larger move. Yet the price at SGD 32.27 is already above the upper band and shows %B at 104%, meaning the stock is trading slightly beyond the top of its recent volatility envelope.
That combination is important. A squeeze can lead to breakout behavior, but a move outside the band without strong volume can also be a short-term overextension. Volume does not yet provide full confirmation: the latest turnover of 4,702,756 is only 0.7× the 20-day average of 6,594,509. In other words, the price is pushing higher on lighter participation, while OBV is rising, which does suggest underlying accumulation is still present. The signal is therefore mixed: participation is not collapsing, but the latest advance is not being backed by a surge in trading activity.
Key Levels & Scenarios
The immediate map is clear. SGD 32.27 is the near-term resistance the stock has just reached, while SGD 30.30 is the nearest support from the 20-hour range. The Bollinger middle band at SGD 31.30 adds another reference point; if the price slips back below that level, the market would be signaling that the breakout attempt is losing traction. The upper Bollinger band at SGD 32.21 has already been exceeded, so the question now is whether the move can hold above it or whether it was simply an intraday overshoot.
If OCBC holds above SGD 32.21 and volume improves, the chart would point toward a continuation attempt toward the SGD 32.57 3-month high. If the price fails to stay above the upper band and drifts back toward SGD 31.30, the market would likely be telling traders that the recent rally needs a cooling-off period. A break below SGD 30.30 would be more meaningful, because it would unwind the current range structure and weaken the short-term trend.
Technical Verdict: HOLD (wait & see)
HOLD (wait & see) fits the chart best because the trend is still positive, but momentum is no longer fully confirming the advance.
- Trend support: price is above SMA20 at SGD 31.30 and SMA50 at SGD 29.13, so the underlying structure remains constructive.
- Momentum caution: Stochastic is overbought and MACD histogram is negative, which signals a rally that may be tiring even before the trend breaks.
- Volatility setup: the Bollinger squeeze suggests a larger move could follow, but the current push is already above the upper band at SGD 32.21 on lighter volume.
Verdict invalidated if price breaks below SGD 30.30, because that would mean the recent range support has failed and the short-term structure has weakened.
- Ideal Entry Range: SGD 31.30 to SGD 30.40
- Exit Target: SGD 32.57
- Stop Loss protection: below SGD 30.30
For non-traders, this means the stock still looks firm, but it is now at a point where the next move needs confirmation rather than assumption.
Summary Data OCBC
| Last price | 32.27 SGD |
| Change 1 day / 5 days / 1 month | 1.10% / 3.86% / 10.02% |
| Trend / MA-cross | uptrend / none |
| SMA20 / SMA50 | 31.30 / 29.13 |
| RSI (14) / Stochastic %K | 69.8 / 87.3 |
| Bollinger %B / ATR | 104% / 0.55 |
| Support / Resistance 20 days | 30.30 / 32.27 |
| Data as of | 4 September 2026 08:00 WIB |
Track OCBC share price daily: live levels, support/resistance and our full OCBC analysis history.